Citibank 2012 Annual Report Download - page 138
Download and view the complete annual report
Please find page 138 of the 2012 Citibank annual report below. You can navigate through the pages in the report by either clicking on the pages listed below, or by using the keyword search tool below to find specific information within the annual report.-
 1
1 -
2
-
3
-
4
-
5
-
6
-
7
-
8
-
9
-
10
-
11
-
12
-
13
-
14
-
15
-
16
-
17
-
18
-
19
-
20
-
21
-
22
-
23
-
24
-
25
-
26
-
27
-
28
-
29
-
30
-
31
-
32
-
33
-
34
-
35
-
36
-
37
-
38
-
39
-
40
-
41
-
42
-
43
-
44
-
45
-
46
-
47
-
48
-
49
-
50
-
51
-
52
-
53
-
54
-
55
-
56
-
57
-
58
-
59
-
60
-
61
-
62
-
63
-
64
-
65
-
66
-
67
-
68
-
69
-
70
-
71
-
72
-
73
-
74
-
75
-
76
-
77
-
78
-
79
-
80
-
81
-
82
-
83
-
84
-
85
-
86
-
87
-
88
-
89
-
90
-
91
-
92
-
93
-
94
-
95
-
96
-
97
-
98
-
99
-
100
-
101
-
102
-
103
-
104
-
105
-
106
-
107
-
108
-
109
-
110
-
111
-
112
-
113
-
114
-
115
-
116
-
117
-
118
-
119
-
120
-
121
-
122
-
123
-
124
-
125
-
126
-
127
-
 128
128 -
 129
129 -
 130
130 -
 131
131 -
 132
132 -
 133
133 -
 134
134 -
 135
135 -
 136
136 -
 137
137 -
 138
138 -
 139
139 -
 140
140 -
 141
141 -
 142
142 -
 143
143 -
 144
144 -
 145
145 -
 146
146 -
 147
147 -
 148
148 -
149
-
150
-
151
-
152
-
153
-
154
-
155
-
156
-
157
-
158
-
159
-
160
-
161
-
162
-
163
-
164
-
165
-
166
-
167
-
168
-
169
-
170
-
171
-
172
-
173
-
174
-
175
-
176
-
177
-
178
-
179
-
180
-
181
-
182
-
183
-
184
-
185
-
186
-
187
-
188
-
189
-
190
-
191
-
192
-
193
-
194
-
195
-
196
-
197
-
198
-
199
-
200
-
201
-
202
-
203
-
204
-
205
-
206
-
207
-
208
-
209
-
210
-
211
-
212
-
213
-
214
-
215
-
216
-
217
-
218
-
219
-
220
-
221
-
222
-
223
-
224
-
225
-
226
-
227
-
228
-
229
-
230
-
231
-
232
-
233
-
234
-
235
-
236
-
237
-
238
-
239
-
240
-
241
-
242
-
243
-
244
-
245
-
246
-
247
-
248
-
249
-
250
-
251
-
252
-
253
-
254
-
255
-
256
-
257
-
258
-
259
-
260
-
261
-
262
-
263
-
264
-
265
-
266
-
267
-
268
-
269
-
270
-
271
-
272
-
273
-
274
-
275
-
276
-
277
-
278
-
279
-
280
-
281
-
282
-
283
-
284
-
285
-
286
-
287
-
288
-
289
-
290
-
291
-
292
-
293
-
294
-
295
-
296
-
297
-
298
-
299
-
300
-
301
-
302
-
303
-
304
-
305
-
306
-
307
-
308
-
309
-
310
-
311
-
312
-
313
-
314
-
315
-
316
-
317
-
318
-
319
-
320
-
321
-
322
-
323
-
324
 |
 |
116
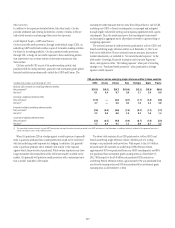
Retail, Small Business and Citi Private Bank
As of December 31, 2012, Citi had approximately $6.2 billion of mostly
locally funded accrual loans to retail, small business and Citi Private Bank
customers in the GIIPS, the vast majority of which was in Citi Holdings.
This compared to $6.3 billion as of September 30, 2012. Of the $6.2 billion,
approximately (i) $3.8 billion consisted of retail and small business
exposures in Spain of $2.7 billion and Greece of $1.1 billion, (ii) $1.5 billion
related to held-to-maturity securitized retail assets (primarily mortgage-
backed securities in Spain), and (iii) $0.8 billion related to Private Bank
customers, substantially all in Spain. This compared to approximately
(i) $4.0 billion of retail and small business exposures in Spain of $2.8 billion
and Greece of $1.2 billion, (ii) $1.5 billion related to held-to-maturity
securitized retail assets, and (iii) $0.8 billion related to Private Bank
customers as of September 30, 2012.
In addition, Citi had approximately $4.1 billion of unfunded commitments
to GIIPS retail customers as of December 31, 2012, unchanged from
September 30, 2012. Citi’s unfunded commitments to GIIPS retail customers,
in the form of unused credit card lines, are generally cancellable upon the
occurrence of significant credit events, including redenomination events.
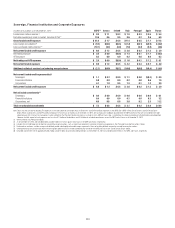
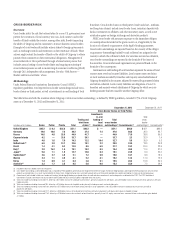
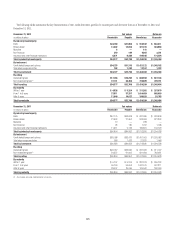
France
Sovereign, Financial Institution and Corporate Exposures
Citi’s gross funded credit exposure to the sovereign entity of France, as well as
financial institutions and multinational and local corporations designated
in France under Citi’s risk management systems, was $11.5 billion at
December 31, 2012, compared to $13.3 billion at September 30, 2012. This
$11.5 billion of gross funded credit exposure at December 31, 2012 was
made up of $5.4 billion in gross funded loans, before reserves (compared
to $6.4 billion at September 30, 2012), and $6.0 billion in derivative
counterparty mark-to-market exposure, inclusive of CVA (compared to
$6.9 billion at September 30, 2012).
Further, as of December 31, 2012, Citi’s net current funded exposure to the
French sovereign and financial institutions and corporations designated in
France under Citi’s risk management systems was $4.0 billion, compared to
$3.6 billion at September 30, 2012.
Net Trading and AFS Exposure—$0.1 billion
Included in the net current funded exposure at December 31, 2012 was a
net position of $0.1 billion in securities and derivatives with the French
sovereign, financial institutions and corporations as the issuer or reference
entity. This compared to a net position of $(0.5) billion of net trading and
AFS exposures as of September 30, 2012. These securities and derivatives are
marked to market daily. Citi’s trading exposure levels vary as it maintains
inventory consistent with customer needs.
Included within the net position of $0.1 billion as of December 2012
was a net position of $0.4 billion of indexed and tranched credit derivatives
(compared to a net position of $0.03 billion at September 30, 2012).
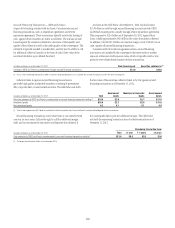
Net Current Funded Credit Exposure—$3.9 billion
As of December 31, 2012, the net current funded credit exposure to the
French sovereign, financial institutions and corporations was $3.9 billion.
Of this amount, none was to the sovereign entity (compared to $0.8 billion
at September 30, 2012), $1.9 billion was to financial institutions (compared
to $2.1 billion at September 30, 2012) and $2.0 billion to corporations
(compared to $1.1 billion at September 30, 2012).
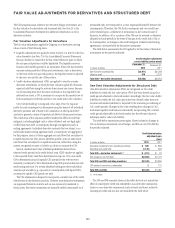
Consistent with its internal risk management measures and as set forth
in the table above, Citi’s gross funded credit exposure has been reduced
by $5.0 billion of margin and collateral posted under legally enforceable
margin agreements (compared to $5.5 billion at September 30, 2012). As
of December 31, 2012, the majority of Citi’s margin and collateral netted
against its gross funded credit exposure to France was in the form of cash,
with the remainder in predominantly non-French securities, which are
included at fair value.
Gross funded credit exposure as of December 31, 2012 has also been
reduced by $2.6 billion in purchased credit protection (compared to
$3.7 billion at September 30, 2012), predominantly from financial
institutions outside France (see “Credit Default Swaps” below). Included
within the $2.6 billion of purchased credit protection as of December 31,
2012 was $0.6 billion of indexed and tranched credit derivatives executed to
hedge Citi’s exposure on funded loans and CVA on derivatives (compared to
$1.4 billion at September 30, 2012).
Purchased credit protection generally pays out only upon the occurrence
of certain credit events with respect to the country or borrower covered by
the protection, as determined by a committee composed of dealers and other
market participants. In addition to general counterparty credit risks, the
credit protection may not fully cover all situations that may adversely affect
the value of Citi’s exposure and, accordingly, Citi could still experience losses
despite the existence of the credit protection.
As of December 31, 2012, Citi also held $4.0 billion of collateral that
has not been netted against its gross funded credit exposure to France, an
increase from $3.5 billion as of September 30, 2012. As described above,
this collateral can take a variety of forms and is held under a variety of
collateral arrangements.
Unfunded Commitments—$14.4 billion
As of December 31, 2012, Citi had $14.4 billion of unfunded commitments
to the French sovereign, financial institutions and corporations, with
$11.2 billion of this amount to corporations. This compared to $13.7 billion
of unfunded commitments as of September 30, 2012, with $10.6 billion
of such amount to corporations. As of December 31, 2012, net unfunded
commitments in France included $11.7 billion of unfunded loan
commitments that generally have standard conditions that must be met
before they can be drawn, and $2.7 billion of letters of credit (compared to
$10.6 billion and $3.1 billion, respectively, as of September 30, 2012).