Citibank 2012 Annual Report Download - page 126
Download and view the complete annual report
Please find page 126 of the 2012 Citibank annual report below. You can navigate through the pages in the report by either clicking on the pages listed below, or by using the keyword search tool below to find specific information within the annual report.-
 1
1 -
2
-
3
-
4
-
5
-
6
-
7
-
8
-
9
-
10
-
11
-
12
-
13
-
14
-
15
-
16
-
17
-
18
-
19
-
20
-
21
-
22
-
23
-
24
-
25
-
26
-
27
-
28
-
29
-
30
-
31
-
32
-
33
-
34
-
35
-
36
-
37
-
38
-
39
-
40
-
41
-
42
-
43
-
44
-
45
-
46
-
47
-
48
-
49
-
50
-
51
-
52
-
53
-
54
-
55
-
56
-
57
-
58
-
59
-
60
-
61
-
62
-
63
-
64
-
65
-
66
-
67
-
68
-
69
-
70
-
71
-
72
-
73
-
74
-
75
-
76
-
77
-
78
-
79
-
80
-
81
-
82
-
83
-
84
-
85
-
86
-
87
-
88
-
89
-
90
-
91
-
92
-
93
-
94
-
95
-
96
-
97
-
98
-
99
-
100
-
101
-
102
-
103
-
104
-
105
-
106
-
107
-
108
-
109
-
110
-
111
-
112
-
113
-
114
-
115
-
 116
116 -
 117
117 -
 118
118 -
 119
119 -
 120
120 -
 121
121 -
 122
122 -
 123
123 -
 124
124 -
 125
125 -
 126
126 -
 127
127 -
 128
128 -
 129
129 -
 130
130 -
 131
131 -
 132
132 -
 133
133 -
 134
134 -
 135
135 -
 136
136 -
137
-
138
-
139
-
140
-
141
-
142
-
143
-
144
-
145
-
146
-
147
-
148
-
149
-
150
-
151
-
152
-
153
-
154
-
155
-
156
-
157
-
158
-
159
-
160
-
161
-
162
-
163
-
164
-
165
-
166
-
167
-
168
-
169
-
170
-
171
-
172
-
173
-
174
-
175
-
176
-
177
-
178
-
179
-
180
-
181
-
182
-
183
-
184
-
185
-
186
-
187
-
188
-
189
-
190
-
191
-
192
-
193
-
194
-
195
-
196
-
197
-
198
-
199
-
200
-
201
-
202
-
203
-
204
-
205
-
206
-
207
-
208
-
209
-
210
-
211
-
212
-
213
-
214
-
215
-
216
-
217
-
218
-
219
-
220
-
221
-
222
-
223
-
224
-
225
-
226
-
227
-
228
-
229
-
230
-
231
-
232
-
233
-
234
-
235
-
236
-
237
-
238
-
239
-
240
-
241
-
242
-
243
-
244
-
245
-
246
-
247
-
248
-
249
-
250
-
251
-
252
-
253
-
254
-
255
-
256
-
257
-
258
-
259
-
260
-
261
-
262
-
263
-
264
-
265
-
266
-
267
-
268
-
269
-
270
-
271
-
272
-
273
-
274
-
275
-
276
-
277
-
278
-
279
-
280
-
281
-
282
-
283
-
284
-
285
-
286
-
287
-
288
-
289
-
290
-
291
-
292
-
293
-
294
-
295
-
296
-
297
-
298
-
299
-
300
-
301
-
302
-
303
-
304
-
305
-
306
-
307
-
308
-
309
-
310
-
311
-
312
-
313
-
314
-
315
-
316
-
317
-
318
-
319
-
320
-
321
-
322
-
323
-
324
 |
 |
104
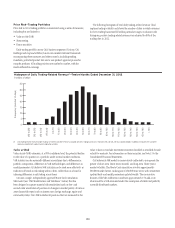
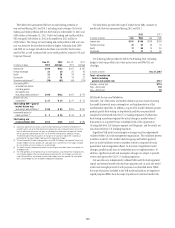
Price Risk—Trading Portfolios
Price risk in Citi’s trading portfolios is monitored using a series of measures,
including but not limited to:
• Value at risk (VAR)
• Stress testing
• Factor sensitivity
Each trading portfolio across Citi’s business segments (Citicorp, Citi
Holdings and Corporate/Other) has its own market risk limit framework
encompassing these measures and other controls, including trading
mandates, permitted product lists and a new product approval process for
complex products. All trading positions are marked to market, with the
results reflected in earnings.
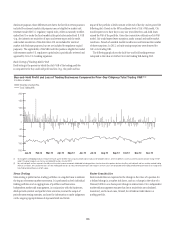
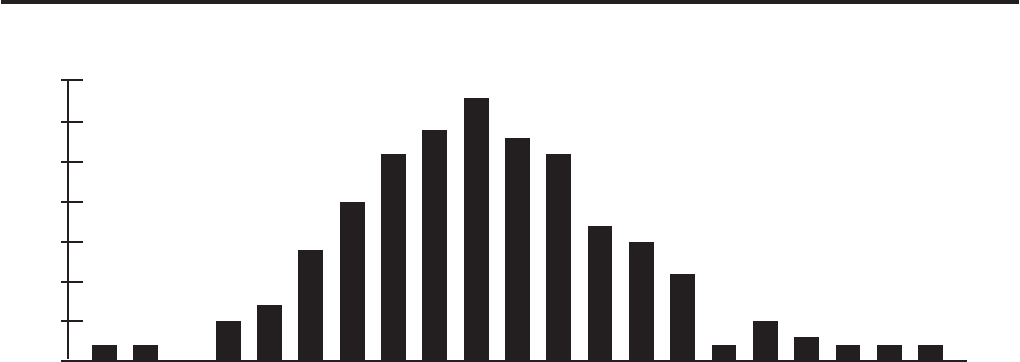
The following histogram of total daily trading-related revenue (loss)
captures trading volatility and shows the number of days in which revenues
for Citi’s trading businesses fell within particular ranges. As shown in the
histogram, positive trading-related revenue was achieved for 96% of the
trading days in 2012.
0
5
10
15
20
25
30
35
(20) to (10)
(40) to (30)
(30) to (20)
50 to 60
40 to 50
30 to 40
20 to 30
10 to 20
0 to 10
(10) to (0)
60 to 70
70 to 80
80 to 90
90 to 100
100 to 110
110 to 120
120 to 130
130 to 140
140 to 150
150 to 160
> 160
Histogram of Daily Trading-Related Revenue(1)—Twelve Months Ended December 31, 2012
In millions of dollars
Frequency (number of days)
(1) Daily trading-related revenue includes trading, net interest and other revenue associated with Citi’s trading businesses. It excludes DVA and CVA, net of associated hedges. In addition, it excludes fees and other
revenue associated with capital markets origination activities.
Value at Risk
Value at risk (VAR) estimates, at a 99% confidence level, the potential decline
in the value of a position or a portfolio under normal market conditions.
VAR statistics can be materially different across firms due to differences in
portfolio composition, differences in VAR methodologies, and differences in
model parameters. Citi believes VAR statistics can be used more effectively as
indicators of trends in risk taking within a firm, rather than as a basis for
inferring differences in risk taking across firms.
Citi uses a single, independently approved Monte Carlo simulation
VAR model (see “VAR Model Review and Validation” below) that has
been designed to capture material risk sensitivities (such as first- and
second-order sensitivities of positions to changes in market prices) of various
asset classes/risk types (such as interest rate, foreign exchange, equity and
commodity risks). Citi’s VAR includes all positions that are measured at fair
value; it does not include investment securities classified as available-for-sale
or held-to-maturity. For information on these securities, see Note 15 to the
Consolidated Financial Statements.
Citi believes its VAR model is conservatively calibrated to incorporate the
greater of short-term (most recent month) and long-term (three years)
market volatility. The Monte Carlo simulation involves approximately
300,000 market factors, making use of 180,000 time series, with sensitivities
updated daily and model parameters updated weekly. The conservative
features of the VAR calibration contribute approximately 15% add-on to
what would be a VAR estimated under the assumption of stable and perfectly
normally distributed markets.