Citibank 2012 Annual Report Download - page 195
Download and view the complete annual report
Please find page 195 of the 2012 Citibank annual report below. You can navigate through the pages in the report by either clicking on the pages listed below, or by using the keyword search tool below to find specific information within the annual report.-
 1
1 -
2
-
3
-
4
-
5
-
6
-
7
-
8
-
9
-
10
-
11
-
12
-
13
-
14
-
15
-
16
-
17
-
18
-
19
-
20
-
21
-
22
-
23
-
24
-
25
-
26
-
27
-
28
-
29
-
30
-
31
-
32
-
33
-
34
-
35
-
36
-
37
-
38
-
39
-
40
-
41
-
42
-
43
-
44
-
45
-
46
-
47
-
48
-
49
-
50
-
51
-
52
-
53
-
54
-
55
-
56
-
57
-
58
-
59
-
60
-
61
-
62
-
63
-
64
-
65
-
66
-
67
-
68
-
69
-
70
-
71
-
72
-
73
-
74
-
75
-
76
-
77
-
78
-
79
-
80
-
81
-
82
-
83
-
84
-
85
-
86
-
87
-
88
-
89
-
90
-
91
-
92
-
93
-
94
-
95
-
96
-
97
-
98
-
99
-
100
-
101
-
102
-
103
-
104
-
105
-
106
-
107
-
108
-
109
-
110
-
111
-
112
-
113
-
114
-
115
-
116
-
117
-
118
-
119
-
120
-
121
-
122
-
123
-
124
-
125
-
126
-
127
-
128
-
129
-
130
-
131
-
132
-
133
-
134
-
135
-
136
-
137
-
138
-
139
-
140
-
141
-
142
-
143
-
144
-
145
-
146
-
147
-
148
-
149
-
150
-
151
-
152
-
153
-
154
-
155
-
156
-
157
-
158
-
159
-
160
-
161
-
162
-
163
-
164
-
165
-
166
-
167
-
168
-
169
-
170
-
171
-
172
-
173
-
174
-
175
-
176
-
177
-
178
-
179
-
180
-
181
-
182
-
183
-
184
-
 185
185 -
 186
186 -
 187
187 -
 188
188 -
 189
189 -
 190
190 -
 191
191 -
 192
192 -
 193
193 -
 194
194 -
 195
195 -
 196
196 -
 197
197 -
 198
198 -
 199
199 -
 200
200 -
 201
201 -
 202
202 -
 203
203 -
 204
204 -
 205
205 -
206
-
207
-
208
-
209
-
210
-
211
-
212
-
213
-
214
-
215
-
216
-
217
-
218
-
219
-
220
-
221
-
222
-
223
-
224
-
225
-
226
-
227
-
228
-
229
-
230
-
231
-
232
-
233
-
234
-
235
-
236
-
237
-
238
-
239
-
240
-
241
-
242
-
243
-
244
-
245
-
246
-
247
-
248
-
249
-
250
-
251
-
252
-
253
-
254
-
255
-
256
-
257
-
258
-
259
-
260
-
261
-
262
-
263
-
264
-
265
-
266
-
267
-
268
-
269
-
270
-
271
-
272
-
273
-
274
-
275
-
276
-
277
-
278
-
279
-
280
-
281
-
282
-
283
-
284
-
285
-
286
-
287
-
288
-
289
-
290
-
291
-
292
-
293
-
294
-
295
-
296
-
297
-
298
-
299
-
300
-
301
-
302
-
303
-
304
-
305
-
306
-
307
-
308
-
309
-
310
-
311
-
312
-
313
-
314
-
315
-
316
-
317
-
318
-
319
-
320
-
321
-
322
-
323
-
324
 |
 |

173
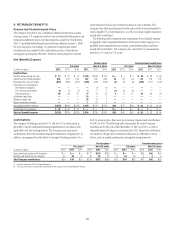
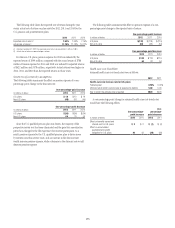
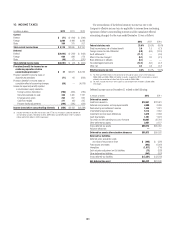
The following table shows the change in Accumulated other
comprehensive income (loss) for the years ended December 31, 2012
and 2011:
In millions of dollars 2012 2011
Balance, January 1, net of tax (1) $(4,282) $(4,105)
Actuarial assumptions changes and plan experience (2) (2,400) (820)
Net asset gain due to actual returns
exceeding expected returns 963 197
Net amortizations 214 183
Foreign exchange impact and other (155) 28
Change in deferred taxes, net 390 235
Change, net of tax $ (988) $ (177)
Balance, December 31, net of tax (1) $(5,270) $(4,282)
(1) See Note 21 to the Consolidated Financial Statements for further discussion of net Accumulated other
comprehensive income (loss) balance.
(2) Includes $62 million and $70 million in net actuarial losses related to U.S. nonqualified pension plans
for 2012 and 2011, respectively.
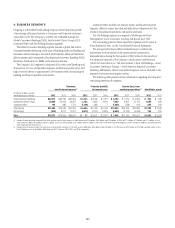
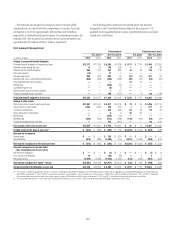
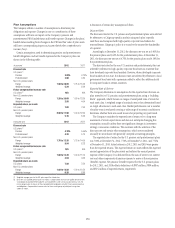
At December 31, 2012 and 2011, for both qualified and nonqualified plans
and for both funded and unfunded plans, the aggregate projected benefit
obligation (PBO), the aggregate accumulated benefit obligation (ABO), and
the aggregate fair value of plan assets are presented for pension plans with
a projected benefit obligation in excess of plan assets and for pension plans
with an accumulated benefit obligation in excess of plan assets as follows:
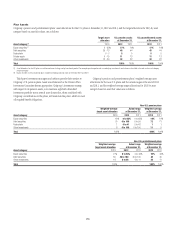
PBO exceeds fair value of plan assets ABO exceeds fair value plan assets
U.S. plans (1) Non-U.S. plans U.S. plans (1) Non-U.S. plans
In millions of dollars 2012 2011 2012 2011 2012 2011 2012 2011
Projected benefit obligation $14,037 $13,089 $ 4,792 $ 2,386 $14,037 $13,089 $2,608 $ 1,970
Accumulated benefit obligation 13,984 13,031 3,876 1,992 13,984 13,031 2,263 1,691
Fair value of plan assets 12,656 11,991 3,784 1,671 12,656 11,991 1,677 1,139
(1) In 2012, the PBO and ABO of the U.S. plans include $13,268 million and $13,246 million, respectively, relating to the qualified plan and $769 million and $738 million, respectively, relating to the nonqualified plans. In
2011, the PBO and ABO of the U.S. plans include $12,377 million and $12,337 million, respectively, relating to the qualified plan and $712 million and $694 million, respectively, relating to the nonqualified plans.
At December 31, 2012, combined accumulated benefit obligations for
the U.S. and non-U.S. pension plans, excluding U.S. nonqualified plans,
were less than plan assets by $0.2 billion. At December 31, 2011, combined
accumulated benefit obligations for the U.S. and non-U.S. pension plans,
excluding U.S. nonqualified plans, exceeded plan assets by $0.6 billion.