Citibank 2012 Annual Report Download - page 213
Download and view the complete annual report
Please find page 213 of the 2012 Citibank annual report below. You can navigate through the pages in the report by either clicking on the pages listed below, or by using the keyword search tool below to find specific information within the annual report.-
 1
1 -
2
-
3
-
4
-
5
-
6
-
7
-
8
-
9
-
10
-
11
-
12
-
13
-
14
-
15
-
16
-
17
-
18
-
19
-
20
-
21
-
22
-
23
-
24
-
25
-
26
-
27
-
28
-
29
-
30
-
31
-
32
-
33
-
34
-
35
-
36
-
37
-
38
-
39
-
40
-
41
-
42
-
43
-
44
-
45
-
46
-
47
-
48
-
49
-
50
-
51
-
52
-
53
-
54
-
55
-
56
-
57
-
58
-
59
-
60
-
61
-
62
-
63
-
64
-
65
-
66
-
67
-
68
-
69
-
70
-
71
-
72
-
73
-
74
-
75
-
76
-
77
-
78
-
79
-
80
-
81
-
82
-
83
-
84
-
85
-
86
-
87
-
88
-
89
-
90
-
91
-
92
-
93
-
94
-
95
-
96
-
97
-
98
-
99
-
100
-
101
-
102
-
103
-
104
-
105
-
106
-
107
-
108
-
109
-
110
-
111
-
112
-
113
-
114
-
115
-
116
-
117
-
118
-
119
-
120
-
121
-
122
-
123
-
124
-
125
-
126
-
127
-
128
-
129
-
130
-
131
-
132
-
133
-
134
-
135
-
136
-
137
-
138
-
139
-
140
-
141
-
142
-
143
-
144
-
145
-
146
-
147
-
148
-
149
-
150
-
151
-
152
-
153
-
154
-
155
-
156
-
157
-
158
-
159
-
160
-
161
-
162
-
163
-
164
-
165
-
166
-
167
-
168
-
169
-
170
-
171
-
172
-
173
-
174
-
175
-
176
-
177
-
178
-
179
-
180
-
181
-
182
-
183
-
184
-
185
-
186
-
187
-
188
-
189
-
190
-
191
-
192
-
193
-
194
-
195
-
196
-
197
-
198
-
199
-
200
-
201
-
202
-
 203
203 -
 204
204 -
 205
205 -
 206
206 -
 207
207 -
 208
208 -
 209
209 -
 210
210 -
 211
211 -
 212
212 -
 213
213 -
 214
214 -
 215
215 -
 216
216 -
 217
217 -
 218
218 -
 219
219 -
 220
220 -
 221
221 -
 222
222 -
 223
223 -
224
-
225
-
226
-
227
-
228
-
229
-
230
-
231
-
232
-
233
-
234
-
235
-
236
-
237
-
238
-
239
-
240
-
241
-
242
-
243
-
244
-
245
-
246
-
247
-
248
-
249
-
250
-
251
-
252
-
253
-
254
-
255
-
256
-
257
-
258
-
259
-
260
-
261
-
262
-
263
-
264
-
265
-
266
-
267
-
268
-
269
-
270
-
271
-
272
-
273
-
274
-
275
-
276
-
277
-
278
-
279
-
280
-
281
-
282
-
283
-
284
-
285
-
286
-
287
-
288
-
289
-
290
-
291
-
292
-
293
-
294
-
295
-
296
-
297
-
298
-
299
-
300
-
301
-
302
-
303
-
304
-
305
-
306
-
307
-
308
-
309
-
310
-
311
-
312
-
313
-
314
-
315
-
316
-
317
-
318
-
319
-
320
-
321
-
322
-
323
-
324
 |
 |

191
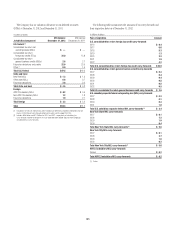
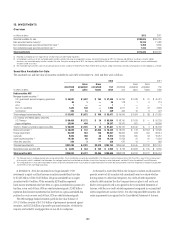
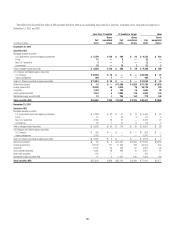
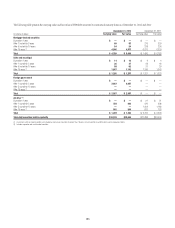
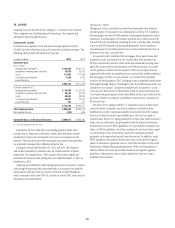
The table below shows the fair value of AFS securities that have been in an unrealized loss position for less than 12 months or for 12 months or longer as of
December 31, 2012 and 2011:
Less than 12 months 12 months or longer Total
In millions of dollars
Fair
value
Gross
unrealized
losses
Fair
value
Gross
unrealized
losses
Fair
value
Gross
unrealized
losses
December 31, 2012
Securities AFS
Mortgage-backed securities
U.S. government-sponsored agency guaranteed $ 8,759 $ 138 $ 464 $ 25 $ 9,223 $ 163
Prime 15 — 5 — 20 —
Non-U.S. residential 5 — 7 — 12 —
Commercial 29 — 24 3 53 3
Total mortgage-backed securities $ 8,808 $ 138 $ 500 $ 28 $ 9,308 $ 166
U.S. Treasury and federal agency securities
U.S. Treasury $ 10,558 $ 34 $ — $ — $ 10,558 $ 34
Agency obligations 496 1 — — 496 1
Total U.S. Treasury and federal agency securities $ 11,054 $ 35 $ — $ — $ 11,054 $ 35
State and municipal $ 10 $ — $ 11,095 $1,820 $ 11,105 $ 1,820
Foreign government 22,806 54 3,910 76 26,716 130
Corporate 1,420 8 225 18 1,645 26
Asset-backed securities 1,942 4 2,888 139 4,830 143
Marketable equity securities AFS 15 1 764 144 779 145
Total securities AFS $ 46,055 $ 240 $ 19,382 $2,225 $ 65,437 $ 2,465
December 31, 2011
Securities AFS
Mortgage-backed securities
U.S. government-sponsored agency guaranteed $ 5,398 $ 32 $ 51 $ 19 $ 5,449 $ 51
Prime 27 1 40 5 67 6
Non-U.S. residential 3,418 22 57 — 3,475 22
Commercial 35 1 31 8 66 9
Total mortgage-backed securities $ 8,878 $ 56 $ 179 $ 32 $ 9,057 $ 88
U.S. Treasury and federal agency securities
U.S. Treasury $ 553 $ — $ — $ — $ 553 $ —
Agency obligations 2,970 2 — — 2,970 2
Total U.S. Treasury and federal agency securities $ 3,523 $ 2 $ — $ — $ 3,523 $ 2
State and municipal $ 59 $ 2 $ 11,591 $ 2,552 $ 11,650 $ 2,554
Foreign government 33,109 211 11,205 193 44,314 404
Corporate 2,104 24 203 29 2,307 53
Asset-backed securities 4,625 68 466 13 5,091 81
Other debt securities 164 — — — 164 —
Marketable equity securities AFS 47 5 1,457 190 1,504 195
Total securities AFS $ 52,509 $ 368 $ 25,101 $ 3,009 $ 77,610 $ 3,377