Citibank 2012 Annual Report Download - page 246
Download and view the complete annual report
Please find page 246 of the 2012 Citibank annual report below. You can navigate through the pages in the report by either clicking on the pages listed below, or by using the keyword search tool below to find specific information within the annual report.-
 1
1 -
2
-
3
-
4
-
5
-
6
-
7
-
8
-
9
-
10
-
11
-
12
-
13
-
14
-
15
-
16
-
17
-
18
-
19
-
20
-
21
-
22
-
23
-
24
-
25
-
26
-
27
-
28
-
29
-
30
-
31
-
32
-
33
-
34
-
35
-
36
-
37
-
38
-
39
-
40
-
41
-
42
-
43
-
44
-
45
-
46
-
47
-
48
-
49
-
50
-
51
-
52
-
53
-
54
-
55
-
56
-
57
-
58
-
59
-
60
-
61
-
62
-
63
-
64
-
65
-
66
-
67
-
68
-
69
-
70
-
71
-
72
-
73
-
74
-
75
-
76
-
77
-
78
-
79
-
80
-
81
-
82
-
83
-
84
-
85
-
86
-
87
-
88
-
89
-
90
-
91
-
92
-
93
-
94
-
95
-
96
-
97
-
98
-
99
-
100
-
101
-
102
-
103
-
104
-
105
-
106
-
107
-
108
-
109
-
110
-
111
-
112
-
113
-
114
-
115
-
116
-
117
-
118
-
119
-
120
-
121
-
122
-
123
-
124
-
125
-
126
-
127
-
128
-
129
-
130
-
131
-
132
-
133
-
134
-
135
-
136
-
137
-
138
-
139
-
140
-
141
-
142
-
143
-
144
-
145
-
146
-
147
-
148
-
149
-
150
-
151
-
152
-
153
-
154
-
155
-
156
-
157
-
158
-
159
-
160
-
161
-
162
-
163
-
164
-
165
-
166
-
167
-
168
-
169
-
170
-
171
-
172
-
173
-
174
-
175
-
176
-
177
-
178
-
179
-
180
-
181
-
182
-
183
-
184
-
185
-
186
-
187
-
188
-
189
-
190
-
191
-
192
-
193
-
194
-
195
-
196
-
197
-
198
-
199
-
200
-
201
-
202
-
203
-
204
-
205
-
206
-
207
-
208
-
209
-
210
-
211
-
212
-
213
-
214
-
215
-
216
-
217
-
218
-
219
-
220
-
221
-
222
-
223
-
224
-
225
-
226
-
227
-
228
-
229
-
230
-
231
-
232
-
233
-
234
-
235
-
 236
236 -
 237
237 -
 238
238 -
 239
239 -
 240
240 -
 241
241 -
 242
242 -
 243
243 -
 244
244 -
 245
245 -
 246
246 -
 247
247 -
 248
248 -
 249
249 -
 250
250 -
 251
251 -
 252
252 -
 253
253 -
 254
254 -
 255
255 -
 256
256 -
257
-
258
-
259
-
260
-
261
-
262
-
263
-
264
-
265
-
266
-
267
-
268
-
269
-
270
-
271
-
272
-
273
-
274
-
275
-
276
-
277
-
278
-
279
-
280
-
281
-
282
-
283
-
284
-
285
-
286
-
287
-
288
-
289
-
290
-
291
-
292
-
293
-
294
-
295
-
296
-
297
-
298
-
299
-
300
-
301
-
302
-
303
-
304
-
305
-
306
-
307
-
308
-
309
-
310
-
311
-
312
-
313
-
314
-
315
-
316
-
317
-
318
-
319
-
320
-
321
-
322
-
323
-
324
 |
 |

224
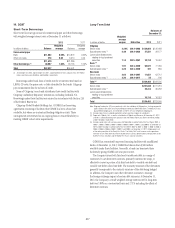
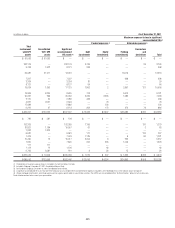
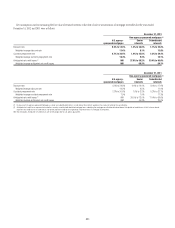
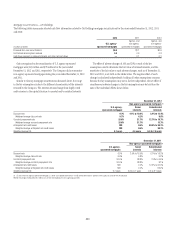
Citigroup’s involvement with consolidated and unconsolidated VIEs with which the Company holds significant variable interests or has continuing
involvement through servicing a majority of the assets in a VIE as of December 31, 2012 and 2011 is presented below:
In millions of dollars As of December 31, 2012
Maximum exposure to loss in significant
unconsolidated VIEs (1)
Funded exposures (2) Unfunded exposures (3)
Citicorp
Total
involvement
with SPE
assets
Consolidated
VIE / SPE assets
Significant
unconsolidated
VIE assets (4)
Debt
investments
Equity
investments
Funding
commitments
Guarantees
and
derivatives Total
Credit card securitizations $ 79,109 $ 79,109 $ — $ — $ — $ — $ — $ —
Mortgage securitizations (5)
U.S. agency-sponsored 232,741 — 232,741 3,042 — — 45 3,087
Non-agency-sponsored 9,308 1,686 7,622 382 — — — 382
Citi-administered asset-backed
commercial paper conduits (ABCP) 30,002 22,387 7,615 — — 7,615 — 7,615
Third-party commercial
paper conduits — — — — — — — —
Collateralized debt obligations (CDOs) 5,539 — 5,539 24 — — — 24
Collateralized loan obligations (CLOs) 15,120 — 15,120 642 19 — — 661
Asset-based financing 41,399 1,125 40,274 14,798 84 2,081 159 17,122
Municipal securities tender option bond
trusts (TOBs) 15,163 7,573 7,590 352 — 4,628 — 4,980
Municipal investments 19,693 255 19,438 2,003 3,049 1,669 — 6,721
Client intermediation 2,486 151 2,335 319 — — — 319
Investment funds 4,286 2,196 2,090 — 14 — — 14
Trust preferred securities 12,221 — 12,221 — 126 — — 126
Other 2,023 115 1,908 113 382 22 76 593
Total $469,090 $114,597 $354,493 $ 21,675 $ 3,674 $ 16,015 $ 280 $ 41,644
Citi Holdings
Credit card securitizations $ 838 $ 397 $ 441 $ — $ — $ — $ — $ —
Mortgage securitizations
U.S. agency-sponsored 106,888 — 106,888 700 — — 163 863
Non-agency-sponsored 16,693 1,628 15,065 43 — — 2 45
Student loan securitizations 1,681 1,681 — — — — — —
Collateralized debt obligations (CDOs) 4,752 — 4,752 139 — — 124 263
Collateralized loan obligations (CLOs) 4,676 — 4,676 435 — 13 108 556
Asset-based financing 4,166 3 4,163 984 6 243 — 1,233
Municipal investments 7,766 — 7,766 90 235 992 — 1,317
Client intermediation 13 13 — — — — — —
Investment funds 1,083 — 1,083 — 47 — — 47
Other 6,005 5,851 154 — 3 — — 3
Total $154,561 $ 9,573 $144,988 $ 2,391 $ 291 $ 1,248 $397 $ 4,327
Total Citigroup $623,651 $124,170 $499,481 $ 24,066 $ 3,965 $ 17,263 $ 677 $ 45,971
(1) The definition of maximum exposure to loss is included in the text that follows this table.
(2) Included in Citigroup’s December 31, 2012 Consolidated Balance Sheet.
(3) Not included in Citigroup’s December 31, 2012 Consolidated Balance Sheet.
(4) A significant unconsolidated VIE is an entity where the Company has any variable interest considered to be significant, regardless of the likelihood of loss or the notional amount of exposure.
(5) Citicorp mortgage securitizations also include agency and non-agency (private-label) re-securitization activities. These SPEs are not consolidated. See “Re-Securitizations” below for further discussion.