Citibank 2012 Annual Report Download - page 28
Download and view the complete annual report
Please find page 28 of the 2012 Citibank annual report below. You can navigate through the pages in the report by either clicking on the pages listed below, or by using the keyword search tool below to find specific information within the annual report.-
 1
1 -
2
-
3
-
4
-
5
-
6
-
7
-
8
-
9
-
10
-
11
-
12
-
13
-
14
-
15
-
16
-
17
-
 18
18 -
 19
19 -
 20
20 -
 21
21 -
 22
22 -
 23
23 -
 24
24 -
 25
25 -
 26
26 -
 27
27 -
 28
28 -
 29
29 -
 30
30 -
 31
31 -
 32
32 -
 33
33 -
 34
34 -
 35
35 -
 36
36 -
 37
37 -
 38
38 -
39
-
40
-
41
-
42
-
43
-
44
-
45
-
46
-
47
-
48
-
49
-
50
-
51
-
52
-
53
-
54
-
55
-
56
-
57
-
58
-
59
-
60
-
61
-
62
-
63
-
64
-
65
-
66
-
67
-
68
-
69
-
70
-
71
-
72
-
73
-
74
-
75
-
76
-
77
-
78
-
79
-
80
-
81
-
82
-
83
-
84
-
85
-
86
-
87
-
88
-
89
-
90
-
91
-
92
-
93
-
94
-
95
-
96
-
97
-
98
-
99
-
100
-
101
-
102
-
103
-
104
-
105
-
106
-
107
-
108
-
109
-
110
-
111
-
112
-
113
-
114
-
115
-
116
-
117
-
118
-
119
-
120
-
121
-
122
-
123
-
124
-
125
-
126
-
127
-
128
-
129
-
130
-
131
-
132
-
133
-
134
-
135
-
136
-
137
-
138
-
139
-
140
-
141
-
142
-
143
-
144
-
145
-
146
-
147
-
148
-
149
-
150
-
151
-
152
-
153
-
154
-
155
-
156
-
157
-
158
-
159
-
160
-
161
-
162
-
163
-
164
-
165
-
166
-
167
-
168
-
169
-
170
-
171
-
172
-
173
-
174
-
175
-
176
-
177
-
178
-
179
-
180
-
181
-
182
-
183
-
184
-
185
-
186
-
187
-
188
-
189
-
190
-
191
-
192
-
193
-
194
-
195
-
196
-
197
-
198
-
199
-
200
-
201
-
202
-
203
-
204
-
205
-
206
-
207
-
208
-
209
-
210
-
211
-
212
-
213
-
214
-
215
-
216
-
217
-
218
-
219
-
220
-
221
-
222
-
223
-
224
-
225
-
226
-
227
-
228
-
229
-
230
-
231
-
232
-
233
-
234
-
235
-
236
-
237
-
238
-
239
-
240
-
241
-
242
-
243
-
244
-
245
-
246
-
247
-
248
-
249
-
250
-
251
-
252
-
253
-
254
-
255
-
256
-
257
-
258
-
259
-
260
-
261
-
262
-
263
-
264
-
265
-
266
-
267
-
268
-
269
-
270
-
271
-
272
-
273
-
274
-
275
-
276
-
277
-
278
-
279
-
280
-
281
-
282
-
283
-
284
-
285
-
286
-
287
-
288
-
289
-
290
-
291
-
292
-
293
-
294
-
295
-
296
-
297
-
298
-
299
-
300
-
301
-
302
-
303
-
304
-
305
-
306
-
307
-
308
-
309
-
310
-
311
-
312
-
313
-
314
-
315
-
316
-
317
-
318
-
319
-
320
-
321
-
322
-
323
-
324
 |
 |

6
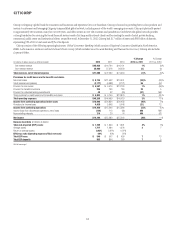
EXECUTIVE SUMMARY
Overview
2012—Ongoing Transformation of Citigroup
During 2012, Citigroup continued to build on the significant transformation
of the Company that has occurred over the last several years. Despite a
challenging operating environment (as discussed below), Citi’s 2012
results showed ongoing momentum in most of its core businesses, as Citi
continued to simplify its business model and focus resources on its core
Citicorp franchise while continuing to wind down Citi Holdings as quickly as
practicable in an economically rational manner. Citi made steady progress
toward the successful execution of its strategy, which is to:
• enhance its position as a leading global bank for both institutions and
individuals, by building on its unique global network, deep emerging
markets expertise, client relationships and product expertise;
• position Citi to seize the opportunities provided by current trends
(globalization, digitization and urbanization) for the benefit of clients;
• further its commitment to responsible finance;
• strengthen Citi’s performance—including gaining market share with
clients, making Citi more efficient and productive, and building upon its
history of innovation; and
• wind down Citi Holdings as soon as practicable, in an economically
rational manner.
With these goals in mind, on December 5, 2012, Citi announced a number
of repositioning efforts to optimize its footprint, re-size and re-align certain
businesses and improve efficiencies, while at the same time maintaining
its unique competitive advantages. As a result of these repositioning efforts,
in the fourth quarter of 2012, Citi recorded pretax repositioning charges of
approximately $1 billion, and expects to incur an additional $100 million of
charges in the first half of 2013.
Continued Challenges in 2013
Citi continued to face a challenging operating environment during 2012,
many aspects of which it expects will continue into 2013. While showing
some signs of improvement, the overall economic environment—both in
the U.S. and globally—remains largely uncertain, and spread compression1
continues to negatively impact the results of operations of several of Citi’s
businesses, particularly in the U.S. and Asia. Citi also continues to face a
significant number of regulatory changes and uncertainties, including the
timing and implementation of the final U.S. regulatory capital standards.
Further, Citi’s legal and related costs remain elevated and likely volatile
as it continues to work through “legacy” issues, such as mortgage-related
expenses, and operates in a heightened litigious and regulatory environment.
Finally, while Citi reduced the size of Citi Holdings by approximately 31%
during 2012, the remaining assets within Citi Holdings will continue to
have a negative impact on Citi’s overall results of operations in 2013,
although this negative impact should continue to abate as the wind-down
continues. For a more detailed discussion of these and other risks that could
impact Citi’s businesses, results of operations and financial condition,
see “Risk Factors” below. As a result of these continuing challenges,
Citi remains highly focused on the areas within its control, including
operational efficiency and optimizing its core businesses in order to drive
improved returns.
1 As used throughout this report, spread compression refers to the reduction in net interest revenue as
a percentage of loans or deposits, as applicable, as driven by either lower yields on interest-earning
assets or higher costs to fund such assets (or a combination thereof).
MANAGEMENT’S DISCUSSION AND ANALYSIS OF FINANCIAL CONDITION AND
RESULTS OF OPERATIONS