Citibank 2012 Annual Report Download - page 275
Download and view the complete annual report
Please find page 275 of the 2012 Citibank annual report below. You can navigate through the pages in the report by either clicking on the pages listed below, or by using the keyword search tool below to find specific information within the annual report.-
 1
1 -
2
-
3
-
4
-
5
-
6
-
7
-
8
-
9
-
10
-
11
-
12
-
13
-
14
-
15
-
16
-
17
-
18
-
19
-
20
-
21
-
22
-
23
-
24
-
25
-
26
-
27
-
28
-
29
-
30
-
31
-
32
-
33
-
34
-
35
-
36
-
37
-
38
-
39
-
40
-
41
-
42
-
43
-
44
-
45
-
46
-
47
-
48
-
49
-
50
-
51
-
52
-
53
-
54
-
55
-
56
-
57
-
58
-
59
-
60
-
61
-
62
-
63
-
64
-
65
-
66
-
67
-
68
-
69
-
70
-
71
-
72
-
73
-
74
-
75
-
76
-
77
-
78
-
79
-
80
-
81
-
82
-
83
-
84
-
85
-
86
-
87
-
88
-
89
-
90
-
91
-
92
-
93
-
94
-
95
-
96
-
97
-
98
-
99
-
100
-
101
-
102
-
103
-
104
-
105
-
106
-
107
-
108
-
109
-
110
-
111
-
112
-
113
-
114
-
115
-
116
-
117
-
118
-
119
-
120
-
121
-
122
-
123
-
124
-
125
-
126
-
127
-
128
-
129
-
130
-
131
-
132
-
133
-
134
-
135
-
136
-
137
-
138
-
139
-
140
-
141
-
142
-
143
-
144
-
145
-
146
-
147
-
148
-
149
-
150
-
151
-
152
-
153
-
154
-
155
-
156
-
157
-
158
-
159
-
160
-
161
-
162
-
163
-
164
-
165
-
166
-
167
-
168
-
169
-
170
-
171
-
172
-
173
-
174
-
175
-
176
-
177
-
178
-
179
-
180
-
181
-
182
-
183
-
184
-
185
-
186
-
187
-
188
-
189
-
190
-
191
-
192
-
193
-
194
-
195
-
196
-
197
-
198
-
199
-
200
-
201
-
202
-
203
-
204
-
205
-
206
-
207
-
208
-
209
-
210
-
211
-
212
-
213
-
214
-
215
-
216
-
217
-
218
-
219
-
220
-
221
-
222
-
223
-
224
-
225
-
226
-
227
-
228
-
229
-
230
-
231
-
232
-
233
-
234
-
235
-
236
-
237
-
238
-
239
-
240
-
241
-
242
-
243
-
244
-
245
-
246
-
247
-
248
-
249
-
250
-
251
-
252
-
253
-
254
-
255
-
256
-
257
-
258
-
259
-
260
-
261
-
262
-
263
-
264
-
 265
265 -
 266
266 -
 267
267 -
 268
268 -
 269
269 -
 270
270 -
 271
271 -
 272
272 -
 273
273 -
 274
274 -
 275
275 -
 276
276 -
 277
277 -
 278
278 -
 279
279 -
 280
280 -
 281
281 -
 282
282 -
 283
283 -
 284
284 -
 285
285 -
286
-
287
-
288
-
289
-
290
-
291
-
292
-
293
-
294
-
295
-
296
-
297
-
298
-
299
-
300
-
301
-
302
-
303
-
304
-
305
-
306
-
307
-
308
-
309
-
310
-
311
-
312
-
313
-
314
-
315
-
316
-
317
-
318
-
319
-
320
-
321
-
322
-
323
-
324
 |
 |
253
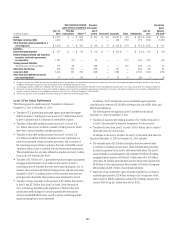
Subprime-related direct exposures in CDOs
The valuation of high-grade and mezzanine asset-backed security (ABS)
CDO positions utilizes prices based on the underlying assets of each high-
grade and mezzanine ABS CDO. The high-grade and mezzanine positions
are largely hedged through the ABX and bond short positions. This results in
closer symmetry in the way these long and short positions are valued by the
Company. Citigroup uses trader marks to value this portion of the portfolio
and will do so as long as it remains largely hedged.
For most of the lending and structuring direct subprime exposures,
fair value is determined utilizing observable transactions where available,
other market data for similar assets in markets that are not active and other
internal valuation techniques.
Investments
The investments category includes available-for-sale debt and marketable
equity securities, whose fair value is generally determined by utilizing similar
procedures described for trading securities above or, in some cases, using
consensus pricing as the primary source.
Also included in investments are nonpublic investments in private equity
and real estate entities held by the S&B business. Determining the fair
value of nonpublic securities involves a significant degree of management
resources and judgment, as no quoted prices exist and such securities are
generally very thinly traded. In addition, there may be transfer restrictions
on private equity securities. The Company uses an established process for
determining the fair value of such securities, utilizing commonly accepted
valuation techniques, including comparables analysis. In determining the
fair value of nonpublic securities, the Company also considers events such
as a proposed sale of the investee company, initial public offerings, equity
issuances or other observable transactions. As discussed in Note 15 to the
ConsolidatedFinancialStatements,theCompanyusesnetassetvalue(NAV)
to value certain of these investments.
PrivateequitysecuritiesaregenerallyclassifiedasLevel3ofthefair
value hierarchy.
Short-term borrowings and long-term debt
Where fair value accounting has been elected, the fair value of non-
structured liabilities is determined by utilizing internal models using the
appropriate discount rate for the applicable maturity. Such instruments are
generallyclassifiedasLevel2ofthefairvaluehierarchy,asallinputsare
readily observable.
The Company determines the fair value of structured liabilities (where
performance is linked to structured interest rates, inflation or currency risks)
and hybrid financial instruments (where performance is linked to risks
other than interest rates, inflation or currency risks) using the appropriate
derivative valuation methodology (described above) given the nature of the
embeddedriskprofile.SuchinstrumentsareclassifiedasLevel2orLevel3
depending on the observability of significant inputs to the model.
Alt-A mortgage securities
The Company classifies its Alt-A mortgage securities as held-to-maturity,
available-for-sale and trading investments. The securities classified as trading
and available-for-sale are recorded at fair value with changes in fair value
reported in current earnings and AOCI, respectively. For these purposes, Citi
defines Alt-A mortgage securities as non-agency residential mortgage-backed
securities (RMBS) where (i) the underlying collateral has weighted average
FICO scores between 680 and 720 or (ii) for instances where FICO scores
are greater than 720, RMBS have 30% or less of the underlying collateral
composed of full documentation loans.
Similar to the valuation methodologies used for other trading securities
and trading loans, the Company generally determines the fair values of
Alt-A mortgage securities utilizing internal valuation techniques. Fair value
estimates from internal valuation techniques are verified, where possible, to
prices obtained from independent vendors. Consensus data providers compile
prices from various sources. Where available, the Company may also make
use of quoted prices for recent trading activity in securities with the same or
similar characteristics to the security being valued.
The valuation techniques used for Alt-A mortgage securities, as with other
mortgage exposures, are price-based and discounted cash flows. The primary
market-derived input is yield. Cash flows are based on current collateral
performance with prepayment rates and loss projections reflective of current
economic conditions of housing price change, unemployment rates, interest
rates, borrower attributes and other market indicators.
Alt-A mortgage securities that are valued using these methods are
generallyclassifiedasLevel2.However,Alt-Amortgagesecuritiesbacked
by Alt-A mortgages of lower quality or subordinated tranches in the capital
structurearemostlyclassifiedasLevel3duetothereducedliquiditythat
exists for such positions, which reduces the reliability of prices available from
independent sources.