Citibank 2012 Annual Report Download - page 45
Download and view the complete annual report
Please find page 45 of the 2012 Citibank annual report below. You can navigate through the pages in the report by either clicking on the pages listed below, or by using the keyword search tool below to find specific information within the annual report.-
 1
1 -
2
-
3
-
4
-
5
-
6
-
7
-
8
-
9
-
10
-
11
-
12
-
13
-
14
-
15
-
16
-
17
-
18
-
19
-
20
-
21
-
22
-
23
-
24
-
25
-
26
-
27
-
28
-
29
-
30
-
31
-
32
-
33
-
34
-
 35
35 -
 36
36 -
 37
37 -
 38
38 -
 39
39 -
 40
40 -
 41
41 -
 42
42 -
 43
43 -
 44
44 -
 45
45 -
 46
46 -
 47
47 -
 48
48 -
 49
49 -
 50
50 -
 51
51 -
 52
52 -
 53
53 -
 54
54 -
 55
55 -
56
-
57
-
58
-
59
-
60
-
61
-
62
-
63
-
64
-
65
-
66
-
67
-
68
-
69
-
70
-
71
-
72
-
73
-
74
-
75
-
76
-
77
-
78
-
79
-
80
-
81
-
82
-
83
-
84
-
85
-
86
-
87
-
88
-
89
-
90
-
91
-
92
-
93
-
94
-
95
-
96
-
97
-
98
-
99
-
100
-
101
-
102
-
103
-
104
-
105
-
106
-
107
-
108
-
109
-
110
-
111
-
112
-
113
-
114
-
115
-
116
-
117
-
118
-
119
-
120
-
121
-
122
-
123
-
124
-
125
-
126
-
127
-
128
-
129
-
130
-
131
-
132
-
133
-
134
-
135
-
136
-
137
-
138
-
139
-
140
-
141
-
142
-
143
-
144
-
145
-
146
-
147
-
148
-
149
-
150
-
151
-
152
-
153
-
154
-
155
-
156
-
157
-
158
-
159
-
160
-
161
-
162
-
163
-
164
-
165
-
166
-
167
-
168
-
169
-
170
-
171
-
172
-
173
-
174
-
175
-
176
-
177
-
178
-
179
-
180
-
181
-
182
-
183
-
184
-
185
-
186
-
187
-
188
-
189
-
190
-
191
-
192
-
193
-
194
-
195
-
196
-
197
-
198
-
199
-
200
-
201
-
202
-
203
-
204
-
205
-
206
-
207
-
208
-
209
-
210
-
211
-
212
-
213
-
214
-
215
-
216
-
217
-
218
-
219
-
220
-
221
-
222
-
223
-
224
-
225
-
226
-
227
-
228
-
229
-
230
-
231
-
232
-
233
-
234
-
235
-
236
-
237
-
238
-
239
-
240
-
241
-
242
-
243
-
244
-
245
-
246
-
247
-
248
-
249
-
250
-
251
-
252
-
253
-
254
-
255
-
256
-
257
-
258
-
259
-
260
-
261
-
262
-
263
-
264
-
265
-
266
-
267
-
268
-
269
-
270
-
271
-
272
-
273
-
274
-
275
-
276
-
277
-
278
-
279
-
280
-
281
-
282
-
283
-
284
-
285
-
286
-
287
-
288
-
289
-
290
-
291
-
292
-
293
-
294
-
295
-
296
-
297
-
298
-
299
-
300
-
301
-
302
-
303
-
304
-
305
-
306
-
307
-
308
-
309
-
310
-
311
-
312
-
313
-
314
-
315
-
316
-
317
-
318
-
319
-
320
-
321
-
322
-
323
-
324
 |
 |
23
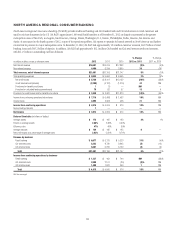
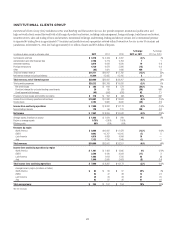
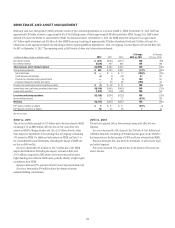
The discussion of the results of operations for Asia RCB below excludes the impact of FX translation for all periods presented. Presentation of the results
of operations, excluding the impact of FX translation, are non-GAAP financial measures. Citi believes the presentation of Asia RCB’s results excluding
the impact of FX translation is a more meaningful depiction of the underlying fundamentals of the business. For a reconciliation of certain of these
metrics to the reported results, see the table above.
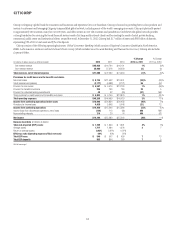
2012 vs. 2011
Net income decreased 4% primarily due to higher expenses.
Revenues were flat year-over-year. Net interest revenue decreased 3%,
as the benefit of higher loan and deposit balances was offset by spread
compression, mainly in retail lending. Spread compression continued to
reflect improvements in the customer risk profile, stricter underwriting
criteria and certain regulatory changes in Korea where, as previously
disclosed, policy actions, including rate caps and other initiatives, have
been implemented to slow the growth of consumer credit in that market,
thus impacting volume growth, lending rates and fees. Spread compression
is expected to continue to have a negative impact on net interest revenue
as regulatory pressure and low interest rates persist. Non-interest revenue
increased 6%, reflecting growth in Citi-branded cards purchase sales, partially
offset by a decrease in revenue from foreign exchange products. Despite the
continued spread compression and regulatory changes in the region, the
underlying business metrics continued to grow, with average retail loans up
6% and average card loans up 2%.
Expenses increased 4%, primarily due to approximately $78 million of
repositioning charges in the fourth quarter of 2012, largely in Korea, and
increased investment spending, including China cards and branches, higher
volume-driven expenses and increased regulatory costs.
Provisions decreased 1%, reflecting continued overall credit quality
improvement. Net credit losses continued to improve, declining 3% due to
the ongoing improvement in credit quality. Citi believes that net credit losses
in Asia RCB will largely remain stable, with increases largely in line with
portfolio growth.
2011 vs. 2010
Net income decreased 12%, driven by higher operating expenses, lower
loan loss reserve releases and a higher effective tax rate, partially offset by
higher revenue. The higher effective tax rate was due to lower tax benefits
Accounting Principles Bulletin (APB) 23 and a tax charge of $66 million due
to a write-down in the value of deferred tax assets due to a change in the tax
law, each in Japan.
Revenues increased 4%, primarily driven by higher business volumes,
partially offset by continued spread compression and $65 million of net
charges relating to the repurchase of certain Lehman structured notes. Net
interest revenue increased 1%, as investment initiatives and economic growth
in the region drove higher lending and deposit volumes. Spread compression
continued to partly offset the benefit of higher balances and continued to
be driven by stricter underwriting criteria, resulting in a lowering of the risk
profile for personal and other loans. Non-interest revenue increased 10%,
primarily due to a 9% increase in Citi-branded cards purchase sales and
higher revenues from foreign exchange products, partially offset by a 16%
decrease in investment sales, particularly in the second half of 2011, and the
net charges for the repurchase of certain Lehman structured notes.
Expenses increased 8%, due to investment spending, growth in business
volumes, repositioning charges and higher legal and related costs, partially
offset by ongoing productivity savings.
Provisions increased 5% as lower loan loss reserve releases were
partially offset by lower net credit losses. The increase in provisions reflected
increasing volumes in the region, partially offset by continued credit quality
improvement. India was a significant driver of the improvement in credit
quality, as it continued to de-risk elements of its legacy portfolio.