Citibank 2012 Annual Report Download - page 167
Download and view the complete annual report
Please find page 167 of the 2012 Citibank annual report below. You can navigate through the pages in the report by either clicking on the pages listed below, or by using the keyword search tool below to find specific information within the annual report.-
 1
1 -
2
-
3
-
4
-
5
-
6
-
7
-
8
-
9
-
10
-
11
-
12
-
13
-
14
-
15
-
16
-
17
-
18
-
19
-
20
-
21
-
22
-
23
-
24
-
25
-
26
-
27
-
28
-
29
-
30
-
31
-
32
-
33
-
34
-
35
-
36
-
37
-
38
-
39
-
40
-
41
-
42
-
43
-
44
-
45
-
46
-
47
-
48
-
49
-
50
-
51
-
52
-
53
-
54
-
55
-
56
-
57
-
58
-
59
-
60
-
61
-
62
-
63
-
64
-
65
-
66
-
67
-
68
-
69
-
70
-
71
-
72
-
73
-
74
-
75
-
76
-
77
-
78
-
79
-
80
-
81
-
82
-
83
-
84
-
85
-
86
-
87
-
88
-
89
-
90
-
91
-
92
-
93
-
94
-
95
-
96
-
97
-
98
-
99
-
100
-
101
-
102
-
103
-
104
-
105
-
106
-
107
-
108
-
109
-
110
-
111
-
112
-
113
-
114
-
115
-
116
-
117
-
118
-
119
-
120
-
121
-
122
-
123
-
124
-
125
-
126
-
127
-
128
-
129
-
130
-
131
-
132
-
133
-
134
-
135
-
136
-
137
-
138
-
139
-
140
-
141
-
142
-
143
-
144
-
145
-
146
-
147
-
148
-
149
-
150
-
151
-
152
-
153
-
154
-
155
-
156
-
 157
157 -
 158
158 -
 159
159 -
 160
160 -
 161
161 -
 162
162 -
 163
163 -
 164
164 -
 165
165 -
 166
166 -
 167
167 -
 168
168 -
 169
169 -
 170
170 -
 171
171 -
 172
172 -
 173
173 -
 174
174 -
 175
175 -
 176
176 -
 177
177 -
178
-
179
-
180
-
181
-
182
-
183
-
184
-
185
-
186
-
187
-
188
-
189
-
190
-
191
-
192
-
193
-
194
-
195
-
196
-
197
-
198
-
199
-
200
-
201
-
202
-
203
-
204
-
205
-
206
-
207
-
208
-
209
-
210
-
211
-
212
-
213
-
214
-
215
-
216
-
217
-
218
-
219
-
220
-
221
-
222
-
223
-
224
-
225
-
226
-
227
-
228
-
229
-
230
-
231
-
232
-
233
-
234
-
235
-
236
-
237
-
238
-
239
-
240
-
241
-
242
-
243
-
244
-
245
-
246
-
247
-
248
-
249
-
250
-
251
-
252
-
253
-
254
-
255
-
256
-
257
-
258
-
259
-
260
-
261
-
262
-
263
-
264
-
265
-
266
-
267
-
268
-
269
-
270
-
271
-
272
-
273
-
274
-
275
-
276
-
277
-
278
-
279
-
280
-
281
-
282
-
283
-
284
-
285
-
286
-
287
-
288
-
289
-
290
-
291
-
292
-
293
-
294
-
295
-
296
-
297
-
298
-
299
-
300
-
301
-
302
-
303
-
304
-
305
-
306
-
307
-
308
-
309
-
310
-
311
-
312
-
313
-
314
-
315
-
316
-
317
-
318
-
319
-
320
-
321
-
322
-
323
-
324
 |
 |

145
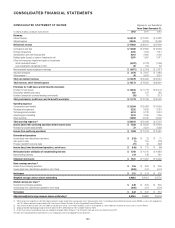
CONSOLIDATED STATEMENT OF CASH FLOWS Citigroup Inc. and Subsidiaries
Years ended December 31,
In millions of dollars 2012 2011 2010
Cash flows from operating activities of continuing operations
Net income before attribution of noncontrolling interests $ 7,760 $ 11,215 $ 10,883
Net income attributable to noncontrolling interests 219 148 281
Citigroup’s net income $ 7,541 $ 11,067 $ 10,602
(Loss) income from discontinued operations, net of taxes (148) 17 215
(Loss) gain on sale, net of taxes (1) 95 (283)
Income from continuing operations—excluding noncontrolling interests $ 7,690 $ 10,955 $ 10,670
Adjustments to reconcile net income to net cash provided by (used in) operating activities of continuing operations
Amortization of deferred policy acquisition costs and present value of future profits 203 250 302
(Additions) reductions to deferred policy acquisition costs 85 (54) (98)
Depreciation and amortization 2,507 2,872 2,664
Deferred tax benefit (4,091) (74) (964)
Provision for credit losses 10,832 11,824 25,077
Realized gains from sales of investments (3,251) (1,997) (2,411)
Net impairment losses recognized in earnings 4,971 2,254 1,411
Change in trading account assets (29,195) 38,238 15,601
Change in trading account liabilities (10,533) (2,972) (8,458)
Change in federal funds sold and securities borrowed or purchased under agreements to resell 14,538 (29,132) (24,695)
Change in federal funds purchased and securities loaned or sold under agreements to repurchase 12,863 8,815 35,277
Change in brokerage receivables net of brokerage payables 945 8,383 (6,676)
Change in loans held-for-sale (1,106) 1,021 2,483
Change in other assets (524) 14,933 (7,538)
Change in other liabilities (1,457) (3,814) (293)
Other, net 9,794 3,277 (6,666)
Total adjustments $ 6,581 $ 53,824 $ 25,016
Net cash provided by operating activities of continuing operations $ 14,271 $ 64,779 $ 35,686
Cash flows from investing activities of continuing operations
Change in deposits with banks $ 53,650 $ 6,653 $ 4,977
Change in loans (28,817) (31,597) 60,730
Proceeds from sales and securitizations of loans 7,287 10,022 9,918
Purchases of investments (256,907) (314,250) (406,046)
Proceeds from sales of investments 143,853 182,566 183,688
Proceeds from maturities of investments 102,020 139,959 189,814
Capital expenditures on premises and equipment and capitalized software (3,604) (3,448) (2,363)
Proceeds from sales of premises and equipment, subsidiaries and affiliates, and repossessed assets 1,089 1,323 2,619
Net cash provided by (used in) investing activities of continuing operations $ 18,571 $ (8,772) $ 43,337
Cash flows from financing activities of continuing operations
Dividends paid $ (143) $ (107) $ (9)
Issuance of preferred stock 2,250 — —
Issuance of ADIA Upper DECs equity units purchase contract —3,750 3,750
Treasury stock acquired (5) (1) (6)
Stock tendered for payment of withholding taxes (194) (230) (806)
Issuance of long-term debt 27,843 30,242 33,677
Payments and redemptions of long-term debt (117,575) (89,091) (75,910)
Change in deposits 64,624 23,858 9,065
Change in short-term borrowings (2,164) (25,067) (47,189)
Net cash used in financing activities of continuing operations $ (25,364) $ (56,646) $ (77,428)
Effect of exchange rate changes on cash and cash equivalents $ 274 $ (1,301) $ 691
Discontinued operations
Net cash provided by discontinued operations $ — $ 2,669 $ 214
Change in cash and due from banks $ 7,752 $ 729 $ 2,500
Cash and due from banks at beginning of year 28,701 27,972 25,472
Cash and due from banks at end of year $ 36,453 $ 28,701 $ 27,972
Supplemental disclosure of cash flow information for continuing operations
Cash paid during the year for income taxes $ 3,900 $ 2,705 $ 4,307
Cash paid during the year for interest $ 19,739 $ 21,230 $ 23,209
Non-cash investing activities
Transfers to OREO and other repossessed assets $ 500 $ 1,284 $ 2,595
Transfers to trading account assets from investments (available-for-sale) —— $ 12,001
Transfers to trading account assets from investments (held-to-maturity) —$ 12,700 —
The Notes to the Consolidated Financial Statements are an integral part of these Consolidated Financial Statements.