Citibank 2012 Annual Report Download - page 120
Download and view the complete annual report
Please find page 120 of the 2012 Citibank annual report below. You can navigate through the pages in the report by either clicking on the pages listed below, or by using the keyword search tool below to find specific information within the annual report.-
 1
1 -
2
-
3
-
4
-
5
-
6
-
7
-
8
-
9
-
10
-
11
-
12
-
13
-
14
-
15
-
16
-
17
-
18
-
19
-
20
-
21
-
22
-
23
-
24
-
25
-
26
-
27
-
28
-
29
-
30
-
31
-
32
-
33
-
34
-
35
-
36
-
37
-
38
-
39
-
40
-
41
-
42
-
43
-
44
-
45
-
46
-
47
-
48
-
49
-
50
-
51
-
52
-
53
-
54
-
55
-
56
-
57
-
58
-
59
-
60
-
61
-
62
-
63
-
64
-
65
-
66
-
67
-
68
-
69
-
70
-
71
-
72
-
73
-
74
-
75
-
76
-
77
-
78
-
79
-
80
-
81
-
82
-
83
-
84
-
85
-
86
-
87
-
88
-
89
-
90
-
91
-
92
-
93
-
94
-
95
-
96
-
97
-
98
-
99
-
100
-
101
-
102
-
103
-
104
-
105
-
106
-
107
-
108
-
109
-
 110
110 -
 111
111 -
 112
112 -
 113
113 -
 114
114 -
 115
115 -
 116
116 -
 117
117 -
 118
118 -
 119
119 -
 120
120 -
 121
121 -
 122
122 -
 123
123 -
 124
124 -
 125
125 -
 126
126 -
 127
127 -
 128
128 -
 129
129 -
 130
130 -
131
-
132
-
133
-
134
-
135
-
136
-
137
-
138
-
139
-
140
-
141
-
142
-
143
-
144
-
145
-
146
-
147
-
148
-
149
-
150
-
151
-
152
-
153
-
154
-
155
-
156
-
157
-
158
-
159
-
160
-
161
-
162
-
163
-
164
-
165
-
166
-
167
-
168
-
169
-
170
-
171
-
172
-
173
-
174
-
175
-
176
-
177
-
178
-
179
-
180
-
181
-
182
-
183
-
184
-
185
-
186
-
187
-
188
-
189
-
190
-
191
-
192
-
193
-
194
-
195
-
196
-
197
-
198
-
199
-
200
-
201
-
202
-
203
-
204
-
205
-
206
-
207
-
208
-
209
-
210
-
211
-
212
-
213
-
214
-
215
-
216
-
217
-
218
-
219
-
220
-
221
-
222
-
223
-
224
-
225
-
226
-
227
-
228
-
229
-
230
-
231
-
232
-
233
-
234
-
235
-
236
-
237
-
238
-
239
-
240
-
241
-
242
-
243
-
244
-
245
-
246
-
247
-
248
-
249
-
250
-
251
-
252
-
253
-
254
-
255
-
256
-
257
-
258
-
259
-
260
-
261
-
262
-
263
-
264
-
265
-
266
-
267
-
268
-
269
-
270
-
271
-
272
-
273
-
274
-
275
-
276
-
277
-
278
-
279
-
280
-
281
-
282
-
283
-
284
-
285
-
286
-
287
-
288
-
289
-
290
-
291
-
292
-
293
-
294
-
295
-
296
-
297
-
298
-
299
-
300
-
301
-
302
-
303
-
304
-
305
-
306
-
307
-
308
-
309
-
310
-
311
-
312
-
313
-
314
-
315
-
316
-
317
-
318
-
319
-
320
-
321
-
322
-
323
-
324
 |
 |

98
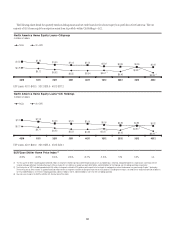
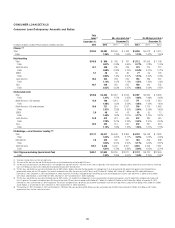
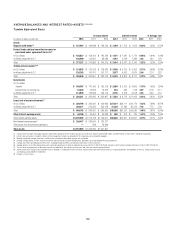
CONSUMER LOAN DETAILS
Consumer Loan Delinquency Amounts and Ratios
Total
loans (1) 90+ days past due (2) 30–89 days past due (2)
December 31, December 31, December 31,
In millions of dollars, except EOP loan amounts in billions and ratios 2012 2012 2011 2010 2012 2011 2010
Citicorp (3)(4)
Total $295.4 $ 3,082 $ 3,406 $ 4,453 $ 3,509 $ 4,072 $ 5,014
Ratio 1.05% 1.19% 1.63% 1.19% 1.42% 1.84%
Retail banking
Total $145.8 $ 880 $ 769 $ 761 $1,112 $ 1,040 $ 1,148
Ratio 0.61% 0.58% 0.66% 0.77% 0.78% 1.00%
North America 42.7 280 235 228 223 213 212
Ratio 0.68% 0.63% 0.76% 0.54% 0.57% 0.71%
EMEA 5.1 48 59 84 77 94 136
Ratio 0.94% 1.40% 2.00% 1.51% 2.24% 3.24%
Latin America 28.3 324 253 224 353 289 267
Ratio 1.14% 1.07% 1.13% 1.25% 1.22% 1.35%
Asia 69.7 228 222 225 459 444 533
Ratio 0.33% 0.33% 0.37% 0.66% 0.66% 0.87%
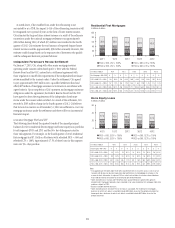
Citi-branded cards
Total $149.6 $ 2,202 $ 2,637 $ 3,692 $ 2,397 $ 3,032 $ 3,866
Ratio 1.47% 1.72% 2.35% 1.60% 1.98% 2.46%
North America—Citi-branded 72.9 786 1,016 1,597 771 1,078 1,540
Ratio 1.08% 1.32% 2.03% 1.06% 1.40% 1.95%
North America—Citi retail services 38.6 721 951 1,351 789 1,175 1,458
Ratio 1.87% 2.38% 3.20% 2.04% 2.94% 3.45%
EMEA 2.9 48 44 58 63 59 72
Ratio 1.66% 1.63% 2.07% 2.17% 2.19% 2.57%
Latin America 14.8 413 412 446 432 399 456
Ratio 2.79% 3.01% 3.33% 2.92% 2.91% 3.40%
Asia 20.4 234 214 240 342 321 340
Ratio 1.15% 1.08% 1.22% 1.68% 1.61% 1.73%
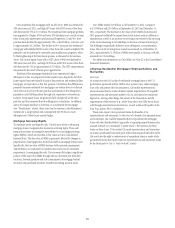
Citi Holdings—Local Consumer Lending (5)(6)
Total $112.7 $ 4,611 $ 5,849 $ 8,864 $4,228 $ 5,148 $ 7,935
Ratio 4.42% 4.66% 5.17% 4.05% 4.10% 4.63%
International 7.6 345 422 657 393 499 848
Ratio 4.54% 3.91% 3.00% 5.17% 4.62% 3.87%
North America 105.1 4,266 5,427 8,207 3,835 4,649 7,087
Ratio 4.41% 4.73% 5.49% 3.96% 4.05% 4.74%
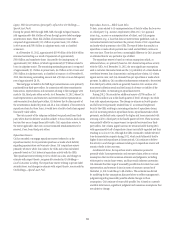
Total Citigroup (excluding Special Asset Pool) $ 408.1 $ 7,693 $ 9,255 $13,317 $ 7,737 $ 9,220 $12,949
Ratio 1.93% 2.25% 3.00% 1.94% 2.24% 2.93%
(1) Total loans include interest and fees on credit cards.
(2) The ratios of 90+ days past due and 30–89 days past due are calculated based on end-of-period (EOP) loans.
(3) The 90+ days past due balances for North America—Citi-branded cards and North America—Citi retail services cards are generally still accruing interest. Citigroup’s policy is generally to accrue interest on credit card
loans until 180 days past due, unless notification of bankruptcy filing has been received earlier.
(4) The 90+ days and 30–89 days past due and related ratios for North America Regional Consumer Banking exclude U.S. mortgage loans that are guaranteed by U.S. government agencies since the potential loss
predominantly resides with the U.S. agencies. The amounts excluded for loans 90+ days past due (and EOP loans) are $742 million ($1.4 billion), $611 million ($1.3 billion) and $235 million ($0.8 billion) at
December 31, 2012, December 31, 2011 and December 31, 2010, respectively. The amounts excluded for loans 30–89 days past due (end-of-period loans have the same adjustment as above) are $122 million,
$121 million and $30 million, as of December 31, 2012, December 31, 2011 and December 31, 2010, respectively.
(5) The 90+ days and 30–89 days past due and related ratios for North America LCL exclude U.S. mortgage loans that are guaranteed by U.S. government agencies since the potential loss predominantly resides with
the U.S. agencies. The amounts excluded for loans 90+ days past due (and EOP loans) for each period are $4.0 billion ($7.1 billion), $4.4 billion ($7.9 billion) and $5.2 billion ($8.4 billion) at December 31, 2012,
December 31, 2011 and December 31, 2010, respectively. The amounts excluded for loans 30–89 days past due (end-of-period loans have the same adjustment as above) for each period are $1.2 billion, $1.5 billion
and $1.6 billion, as of December 31, 2012, December 31, 2011 and December 31, 2010, respectively.
(6) The December 31, 2012, December 31, 2011 and December 31, 2010 loans 90+ days past due and 30–89 days past due and related ratios for North America exclude $1.2 billion, $1.3 billion and $1.7 billion,
respectively, of loans that are carried at fair value.