Citibank 2012 Annual Report Download - page 60
Download and view the complete annual report
Please find page 60 of the 2012 Citibank annual report below. You can navigate through the pages in the report by either clicking on the pages listed below, or by using the keyword search tool below to find specific information within the annual report.-
 1
1 -
2
-
3
-
4
-
5
-
6
-
7
-
8
-
9
-
10
-
11
-
12
-
13
-
14
-
15
-
16
-
17
-
18
-
19
-
20
-
21
-
22
-
23
-
24
-
25
-
26
-
27
-
28
-
29
-
30
-
31
-
32
-
33
-
34
-
35
-
36
-
37
-
38
-
39
-
40
-
41
-
42
-
43
-
44
-
45
-
46
-
47
-
48
-
49
-
 50
50 -
 51
51 -
 52
52 -
 53
53 -
 54
54 -
 55
55 -
 56
56 -
 57
57 -
 58
58 -
 59
59 -
 60
60 -
 61
61 -
 62
62 -
 63
63 -
 64
64 -
 65
65 -
 66
66 -
 67
67 -
 68
68 -
 69
69 -
 70
70 -
71
-
72
-
73
-
74
-
75
-
76
-
77
-
78
-
79
-
80
-
81
-
82
-
83
-
84
-
85
-
86
-
87
-
88
-
89
-
90
-
91
-
92
-
93
-
94
-
95
-
96
-
97
-
98
-
99
-
100
-
101
-
102
-
103
-
104
-
105
-
106
-
107
-
108
-
109
-
110
-
111
-
112
-
113
-
114
-
115
-
116
-
117
-
118
-
119
-
120
-
121
-
122
-
123
-
124
-
125
-
126
-
127
-
128
-
129
-
130
-
131
-
132
-
133
-
134
-
135
-
136
-
137
-
138
-
139
-
140
-
141
-
142
-
143
-
144
-
145
-
146
-
147
-
148
-
149
-
150
-
151
-
152
-
153
-
154
-
155
-
156
-
157
-
158
-
159
-
160
-
161
-
162
-
163
-
164
-
165
-
166
-
167
-
168
-
169
-
170
-
171
-
172
-
173
-
174
-
175
-
176
-
177
-
178
-
179
-
180
-
181
-
182
-
183
-
184
-
185
-
186
-
187
-
188
-
189
-
190
-
191
-
192
-
193
-
194
-
195
-
196
-
197
-
198
-
199
-
200
-
201
-
202
-
203
-
204
-
205
-
206
-
207
-
208
-
209
-
210
-
211
-
212
-
213
-
214
-
215
-
216
-
217
-
218
-
219
-
220
-
221
-
222
-
223
-
224
-
225
-
226
-
227
-
228
-
229
-
230
-
231
-
232
-
233
-
234
-
235
-
236
-
237
-
238
-
239
-
240
-
241
-
242
-
243
-
244
-
245
-
246
-
247
-
248
-
249
-
250
-
251
-
252
-
253
-
254
-
255
-
256
-
257
-
258
-
259
-
260
-
261
-
262
-
263
-
264
-
265
-
266
-
267
-
268
-
269
-
270
-
271
-
272
-
273
-
274
-
275
-
276
-
277
-
278
-
279
-
280
-
281
-
282
-
283
-
284
-
285
-
286
-
287
-
288
-
289
-
290
-
291
-
292
-
293
-
294
-
295
-
296
-
297
-
298
-
299
-
300
-
301
-
302
-
303
-
304
-
305
-
306
-
307
-
308
-
309
-
310
-
311
-
312
-
313
-
314
-
315
-
316
-
317
-
318
-
319
-
320
-
321
-
322
-
323
-
324
 |
 |
38
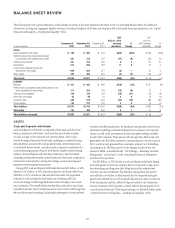
Federal Funds Sold and Securities Borrowed or
Purchased Under Agreements to Resell (Reverse Repos)
Federal funds sold consist of unsecured advances to third parties of excess
balances in reserve accounts held at the Federal Reserve Banks. During 2011
and 2012, Citi’s federal funds sold were not significant.
Reverse repos and securities borrowing transactions decreased by
$15 billion, or 5%, during 2012, and declined $17 billion, or 6%, compared to
the third quarter of 2012. The majority of this decrease was due to changes in
the mix of assets within certain Securities and Banking businesses between
reverse repos and trading account assets.
For further information regarding these balance sheet categories, see
Notes 1 and 12 to the Consolidated Financial Statements.
Trading Account Assets
Trading account assets includes debt and marketable equity securities,
derivatives in a net receivable position, residual interests in securitizations
and physical commodities inventory. In addition, certain assets that
Citigroup has elected to carry at fair value, such as certain loans and
purchase guarantees, are also included in Trading account assets.
During 2012, trading account assets increased $29 billion, or 10%,
primarily due to increases in equity securities ($24 billion, or 72%), foreign
government securities ($10 billion, or 12%), and mortgage-backed securities
($4 billion, or 13%), partially offset by an $8 billion, or 12%, decrease in
derivative assets. A significant portion of the increase in Citi’s trading account
assets (approximately half of which occurred in the first quarter of 2012,
with the remainder of the growth occurring steadily during the rest of 2012)
was the reversal of reductions in trading positions during the second half of
2011 as a result of the economic uncertainty that largely began in the third
quarter of 2011 and continued into the fourth quarter. During 2011, Citi
reduced its rates trading in the G10, particularly in Europe, given the market
environment in the region, and credit trading and securitized markets also
declined due to reduced client volume and less market liquidity. In 2012,
the increases in trading assets and the assets classes noted above were the
result of a more favorable market environment and more robust trading
activities, as well as a change in the asset mix of positions held in certain
equities businesses.
Average trading account assets were $251 billion in 2012, compared to
$270 billion in 2011. The decrease versus the prior year reflected the higher
levels of trading assets (excluding derivative assets) during the first half of
2011, prior to the de-risking and market-related reductions noted above.
For further information on Citi’s trading account assets, see Notes 1 and
14 to the Consolidated Financial Statements.
Investments
Investments consist of debt and equity securities that are available-for-sale,
debt securities that are held-to-maturity, non-marketable equity securities
that are carried at fair value, and non-marketable equity securities carried
at cost. Debt securities include bonds, notes and redeemable preferred
stock, as well as certain mortgage-backed and asset-backed securities and
other structured notes. Marketable and non-marketable equity securities
carried at fair value include common and nonredeemable preferred stock.
Nonmarketable equity securities carried at cost primarily include equity
shares issued by the Federal Reserve Bank and the Federal Home Loan Banks
that Citigroup is required to hold.
During 2012, investments increased by $19 billion, or 6%, primarily due
to a $23 billion, or 9%, increase in AFS, predominantly foreign government
and U.S. Treasury securities, partially offset by a $1 billion decrease in held-
to-maturity securities. The majority of this increase occurred during the
fourth quarter of 2012, where investments increased $17 billion, or 6%, in
total. The increase in AFS was part of the continued balance sheet strategy to
redeploy excess cash into higher-yielding investments.
As noted above, the increase in AFS included growth in foreign
government securities (as the increase in deposits in many countries resulted
in higher liquid resources and drove the investment in foreign government
AFS, primarily in Asia and Latin America) and U.S. Treasury securities.
This growth and reallocation was supplemented by smaller increases in
mortgage-backed securities (both U.S. government agency MBS and non-U.S.
residential MBS), municipal securities and other asset-backed securities,
partially offset by a reduction in U.S. federal agency securities.
For further information regarding investments, see Notes 1 and 15 to the
Consolidated Financial Statements.