Citibank 2012 Annual Report Download - page 58
Download and view the complete annual report
Please find page 58 of the 2012 Citibank annual report below. You can navigate through the pages in the report by either clicking on the pages listed below, or by using the keyword search tool below to find specific information within the annual report.
36
SPECIAL ASSET POOL
The Special Asset Pool (SAP) consists of a portfolio of securities, loans and other assets that Citigroup intends to continue to reduce over time through asset sales
and portfolio run-off. SAP had approximately $21 billion of assets as of December 31, 2012, which constituted approximately 13% of Citi Holdings assets.
In millions of dollars, except as otherwise noted 2012 2011 2010
% Change
2012 vs. 2011
% Change
2011 vs. 2010
Net interest revenue $(287) $(405) $ 1,219 29% NM
Non-interest revenue (213) 952 1,633 NM (42)%
Revenues, net of interest expense $(500) $ 547 $ 2,852 NM (81)%
Total operating expenses $ 326 $ 293 $ 571 11% (49)%
Net credit losses $ (28) $ 1,068 $ 2,013 NM (47)%
Credit reserve builds (releases) (140) (1,855) (1,711) 92 (8)
Provision (releases) for unfunded lending commitments (56) (40) (76) (40) 47
Provisions for credit losses and for benefits and claims $(224) $ (827) $ 226 73% NM
Income (loss) from continuing operations before taxes $(602) $ 1,081 $ 2,055 NM (47)%
Income taxes (benefits) (425) 485 897 NM (46)
Net income (loss) from continuing operations $(177) $ 596 $ 1,158 NM (49)%
Noncontrolling interests —108 188 (100)% (43)
Net income (loss) $(177) $ 488 $ 970 NM (50)%
EOP assets (in billions of dollars) $ 21 $ 41 $ 80 (49)% (49)%
NM Not meaningful
2012 vs. 2011
The net loss of $177 million reflected a decline of $665 million compared to
net income of $488 million in 2011, mainly driven by a decrease in revenues
and higher credit costs, partially offset by a tax benefit on the sale of a
business in 2012.
Revenues were $(500) million. CVA/DVA was $157 million, compared
to $74 million in 2011. Excluding the impact of CVA/DVA, revenues in SAP
were $(657) million, compared to $473 million in 2011. The decline in
revenues was driven in part by lower non-interest revenue due to the absence
of positive private equity marks and lower gains on asset sales, as well as an
aggregate repurchase reserve build in 2012 of approximately $244 million
related to private-label mortgage securitizations (see “Managing Global
Risk—Credit Risk—Citigroup Residential Mortgages—Representations
and Warranties” below). The loss in net interest revenues improved from the
prior year due to lower funding costs, but remained negative. Citi expects
continued negative net interest revenues, as interest earning assets continue
to be a smaller portion of the overall asset pool.
Expenses increased 11%, driven by higher legal and related costs, partially
offset by lower expenses from lower volume and asset levels.
Provisions were a benefit of $224 million, which represented a 73%
decline from 2011 due to a decrease in loan loss reserve releases (a release of
$140 million compared to a release of $1.9 billion in 2011), partially offset
by a $1.1 billion decline in net credit losses.
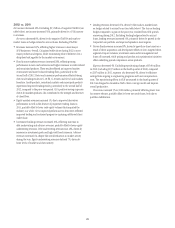
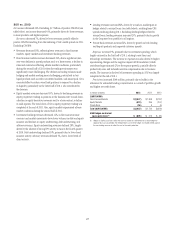
Assets declined 49% to $21 billion, primarily driven by sales, amortization
and prepayments. Asset sales of $11 billion generated pretax gains of
approximately $0.3 billion, compared to asset sales of $29 billion and pretax
gains of $0.5 billion in 2011.
2011 vs. 2010
Net income decreased 50%, driven by the decrease in revenues due to lower
asset balances, partially offset by lower expenses and improved credit.
Revenues decreased 81%, driven by the overall decline in net interest
revenue during the year, as interest-earning assets declined and thus
represented a smaller portion of the overall asset pool. Non-interest revenue
decreased by 42% due to lower gains on asset sales and the absence of positive
private equity marks from the prior-year period.
Expenses decreased 49%, driven by lower volume and asset levels, as well
as lower legal and related costs.
Provisions were a benefit of $827 million, which represented an
improvement of $1.1 billion from the prior year, as credit conditions
improved during 2011. The improvement was primarily driven by a
$945 million decrease in net credit losses as well as an increase in loan loss
reserve releases.
Assets declined 49%, primarily driven by sales, amortization and
prepayments. Asset sales of $29 billion generated pretax gains of
approximately $0.5 billion, compared to asset sales of $39 billion and pretax
gains of $1.3 billion in 2010.


