Citibank 2012 Annual Report Download - page 121
Download and view the complete annual report
Please find page 121 of the 2012 Citibank annual report below. You can navigate through the pages in the report by either clicking on the pages listed below, or by using the keyword search tool below to find specific information within the annual report.-
 1
1 -
2
-
3
-
4
-
5
-
6
-
7
-
8
-
9
-
10
-
11
-
12
-
13
-
14
-
15
-
16
-
17
-
18
-
19
-
20
-
21
-
22
-
23
-
24
-
25
-
26
-
27
-
28
-
29
-
30
-
31
-
32
-
33
-
34
-
35
-
36
-
37
-
38
-
39
-
40
-
41
-
42
-
43
-
44
-
45
-
46
-
47
-
48
-
49
-
50
-
51
-
52
-
53
-
54
-
55
-
56
-
57
-
58
-
59
-
60
-
61
-
62
-
63
-
64
-
65
-
66
-
67
-
68
-
69
-
70
-
71
-
72
-
73
-
74
-
75
-
76
-
77
-
78
-
79
-
80
-
81
-
82
-
83
-
84
-
85
-
86
-
87
-
88
-
89
-
90
-
91
-
92
-
93
-
94
-
95
-
96
-
97
-
98
-
99
-
100
-
101
-
102
-
103
-
104
-
105
-
106
-
107
-
108
-
109
-
110
-
 111
111 -
 112
112 -
 113
113 -
 114
114 -
 115
115 -
 116
116 -
 117
117 -
 118
118 -
 119
119 -
 120
120 -
 121
121 -
 122
122 -
 123
123 -
 124
124 -
 125
125 -
 126
126 -
 127
127 -
 128
128 -
 129
129 -
 130
130 -
 131
131 -
132
-
133
-
134
-
135
-
136
-
137
-
138
-
139
-
140
-
141
-
142
-
143
-
144
-
145
-
146
-
147
-
148
-
149
-
150
-
151
-
152
-
153
-
154
-
155
-
156
-
157
-
158
-
159
-
160
-
161
-
162
-
163
-
164
-
165
-
166
-
167
-
168
-
169
-
170
-
171
-
172
-
173
-
174
-
175
-
176
-
177
-
178
-
179
-
180
-
181
-
182
-
183
-
184
-
185
-
186
-
187
-
188
-
189
-
190
-
191
-
192
-
193
-
194
-
195
-
196
-
197
-
198
-
199
-
200
-
201
-
202
-
203
-
204
-
205
-
206
-
207
-
208
-
209
-
210
-
211
-
212
-
213
-
214
-
215
-
216
-
217
-
218
-
219
-
220
-
221
-
222
-
223
-
224
-
225
-
226
-
227
-
228
-
229
-
230
-
231
-
232
-
233
-
234
-
235
-
236
-
237
-
238
-
239
-
240
-
241
-
242
-
243
-
244
-
245
-
246
-
247
-
248
-
249
-
250
-
251
-
252
-
253
-
254
-
255
-
256
-
257
-
258
-
259
-
260
-
261
-
262
-
263
-
264
-
265
-
266
-
267
-
268
-
269
-
270
-
271
-
272
-
273
-
274
-
275
-
276
-
277
-
278
-
279
-
280
-
281
-
282
-
283
-
284
-
285
-
286
-
287
-
288
-
289
-
290
-
291
-
292
-
293
-
294
-
295
-
296
-
297
-
298
-
299
-
300
-
301
-
302
-
303
-
304
-
305
-
306
-
307
-
308
-
309
-
310
-
311
-
312
-
313
-
314
-
315
-
316
-
317
-
318
-
319
-
320
-
321
-
322
-
323
-
324
 |
 |

99
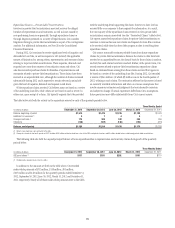
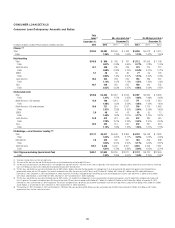
Consumer Loan Net Credit Losses and Ratios
Average
loans (1) Net credit losses (2)
In millions of dollars, except average loan amounts in billions and ratios 2012 2012 2011 2010
Citicorp
Total $286.4 $ 8,452 $10,840 $16,328
Ratio 2.95% 3.93% 6.22%
Retail banking
Total $140.9 $ 1,258 $ 1,190 $ 1,281
Ratio 0.89% 0.94% 1.17%
North America 41.3 247 302 341
Ratio 0.60% 0.88% 1.12%
EMEA 4.7 46 87 166
Ratio 0.98% 1.98% 3.84%
Latin America 26.3 648 475 439
Ratio 2.46% 2.14% 2.42%
Asia 68.6 317 326 335
Ratio 0.46% 0.50% 0.59%
Cards
Total $145.5 $ 7,194 $ 9,650 $15,047
Ratio 4.94% 6.48% 9.84%
North America—Citi-branded 71.9 3,187 4,668 7,683
Ratio 4.43% 6.28% 9.86%
North America—Citi retail services 36.9 2,322 3,131 5,108
Ratio 6.29% 8.13% 12.10%
EMEA 2.8 59 85 149
Ratio 2.09% 2.98% 5.32%
Latin America 14.1 1,102 1,209 1,429
Ratio 7.84% 8.82% 11.67%
Asia 19.8 524 557 678
Ratio 2.65% 2.85% 3.83%
Citi Holdings—Local Consumer Lending
Total (3)(4) $124.3 $ 5,870 $ 7,504 $11,928
Ratio 4.72% 4.69% 5.16%
International 9.4 536 1,057 1,927
Ratio 5.72% 6.30% 7.36%
North America (3)(4) 114.9 5,334 6,447 10,001
Ratio 4.64% 4.50% 4.88%
Total Citigroup (excluding Special Asset Pool) (3)(4) $410.7 $14,322 $18,344 $28,256
Ratio 3.49% 4.21% 5.72%
(1) Average loans include interest and fees on credit cards.
(2) The ratios of net credit losses are calculated based on average loans, net of unearned income.
(3) 2012 includes approximately $635 million of incremental charge-offs related to OCC guidance issued in the third quarter of 2012, which required mortgage loans to borrowers that have gone through Chapter 7 of the
U.S. Bankruptcy Code to be written down to collateral value. There was a corresponding approximately $600 million release in the third quarter of 2012 allowance for loan losses related to these charge-offs. 2012 also
includes a benefit to charge-offs of approximately $40 million related to finalizing the impact of the OCC guidance in the fourth quarter of 2012.
(4) 2012 includes approximately $370 million of incremental charge-offs related to previously deferred principal balances on modified mortgages in the first quarter of 2012. These charge-offs were related to anticipated
forgiveness of principal in connection with the national mortgage settlement. There was a corresponding approximately $350 million reserve release in the first quarter of 2012 related to these charge-offs. See also
“Credit Risk—National Mortgage Settlement” below.