Citibank 2012 Annual Report Download - page 286
Download and view the complete annual report
Please find page 286 of the 2012 Citibank annual report below. You can navigate through the pages in the report by either clicking on the pages listed below, or by using the keyword search tool below to find specific information within the annual report.-
 1
1 -
2
-
3
-
4
-
5
-
6
-
7
-
8
-
9
-
10
-
11
-
12
-
13
-
14
-
15
-
16
-
17
-
18
-
19
-
20
-
21
-
22
-
23
-
24
-
25
-
26
-
27
-
28
-
29
-
30
-
31
-
32
-
33
-
34
-
35
-
36
-
37
-
38
-
39
-
40
-
41
-
42
-
43
-
44
-
45
-
46
-
47
-
48
-
49
-
50
-
51
-
52
-
53
-
54
-
55
-
56
-
57
-
58
-
59
-
60
-
61
-
62
-
63
-
64
-
65
-
66
-
67
-
68
-
69
-
70
-
71
-
72
-
73
-
74
-
75
-
76
-
77
-
78
-
79
-
80
-
81
-
82
-
83
-
84
-
85
-
86
-
87
-
88
-
89
-
90
-
91
-
92
-
93
-
94
-
95
-
96
-
97
-
98
-
99
-
100
-
101
-
102
-
103
-
104
-
105
-
106
-
107
-
108
-
109
-
110
-
111
-
112
-
113
-
114
-
115
-
116
-
117
-
118
-
119
-
120
-
121
-
122
-
123
-
124
-
125
-
126
-
127
-
128
-
129
-
130
-
131
-
132
-
133
-
134
-
135
-
136
-
137
-
138
-
139
-
140
-
141
-
142
-
143
-
144
-
145
-
146
-
147
-
148
-
149
-
150
-
151
-
152
-
153
-
154
-
155
-
156
-
157
-
158
-
159
-
160
-
161
-
162
-
163
-
164
-
165
-
166
-
167
-
168
-
169
-
170
-
171
-
172
-
173
-
174
-
175
-
176
-
177
-
178
-
179
-
180
-
181
-
182
-
183
-
184
-
185
-
186
-
187
-
188
-
189
-
190
-
191
-
192
-
193
-
194
-
195
-
196
-
197
-
198
-
199
-
200
-
201
-
202
-
203
-
204
-
205
-
206
-
207
-
208
-
209
-
210
-
211
-
212
-
213
-
214
-
215
-
216
-
217
-
218
-
219
-
220
-
221
-
222
-
223
-
224
-
225
-
226
-
227
-
228
-
229
-
230
-
231
-
232
-
233
-
234
-
235
-
236
-
237
-
238
-
239
-
240
-
241
-
242
-
243
-
244
-
245
-
246
-
247
-
248
-
249
-
250
-
251
-
252
-
253
-
254
-
255
-
256
-
257
-
258
-
259
-
260
-
261
-
262
-
263
-
264
-
265
-
266
-
267
-
268
-
269
-
270
-
271
-
272
-
273
-
274
-
275
-
 276
276 -
 277
277 -
 278
278 -
 279
279 -
 280
280 -
 281
281 -
 282
282 -
 283
283 -
 284
284 -
 285
285 -
 286
286 -
 287
287 -
 288
288 -
 289
289 -
 290
290 -
 291
291 -
 292
292 -
 293
293 -
 294
294 -
 295
295 -
 296
296 -
297
-
298
-
299
-
300
-
301
-
302
-
303
-
304
-
305
-
306
-
307
-
308
-
309
-
310
-
311
-
312
-
313
-
314
-
315
-
316
-
317
-
318
-
319
-
320
-
321
-
322
-
323
-
324
 |
 |

264
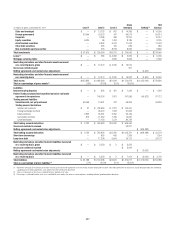
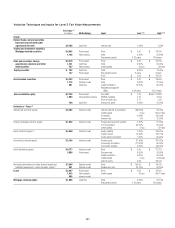
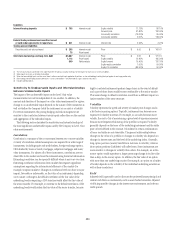
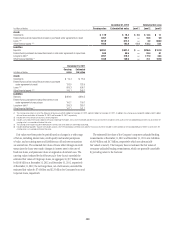
Liabilities
Interest-bearing deposits $ 785 Internal model Equity volatility 11.13% 86.10%
Forward price 67.80% 182.00%
Commodity correlation (76.00)% 95.00%
Commodity volatility 5.00% 148.00%
Federal funds purchased and securities loaned
or sold under agreements to repurchase $ 841 Internal model Interest rate 0.33% 4.91%
Trading account liabilities
Securities sold, not yet purchased $ 265 Internal model Price $ 0.00 $ 166.47
75 Price-based
Short-term borrowings and long-term debt $5,067 Internal model Price $ 0.00 $ 121.16
1,112 Price-based Equity volatility 12.40% 185.20%
649 Yield analysis Equity forward 75.40% 132.70%
Equity-equity correlation 1.00% 99.90%
Equity-FX correlation (80.50)% 50.40%
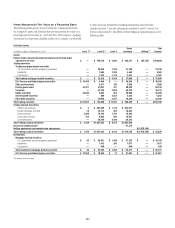
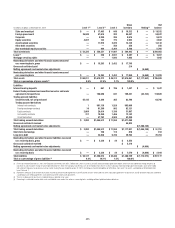
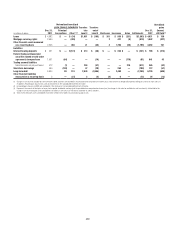
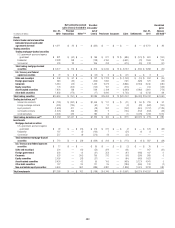
(1) The fair value amounts presented in this table represent the primary valuation technique or techniques for each class of assets or liabilities.
(2) Some inputs are shown as zero due to rounding.
(3) When the low and high inputs are the same, there is either a constant input applied to all positions, or the methodology involving the input applies to one large position only.
(4) Both trading and nontrading account derivatives—assets and liabilities—are presented on a gross absolute value basis.
(5) Includes hybrid products.
Sensitivity to Unobservable Inputs and Interrelationships
between Unobservable Inputs
The impact of key unobservable inputs on the Level 3 fair value
measurements may not be independent of one another. In addition, the
amount and direction of the impact on a fair value measurement for a given
change in an unobservable input depends on the nature of the instrument as
well as whether the Company holds the instrument as an asset or a liability.
For certain instruments, the pricing hedging and risk management are
sensitive to the correlation between various inputs rather than on the analysis
and aggregation of the individual inputs.
The following section describes the sensitivities and interrelationships of
the most significant unobservable inputs used by the Company in Level 3 fair
value measurements.
Correlation
Correlation is a measure of the co-movement between two or more variables.
A variety of correlation-related assumptions are required for a wide range of
instruments, including equity and credit baskets, foreign-exchange options,
CDOs backed by loans or bonds, mortgages, subprime mortgages and many
other instruments. For almost all of these instruments, correlations are not
observable in the market and must be estimated using historical information.
Estimating correlation can be especially difficult where it may vary over time.
Extracting correlation information from market data requires significant
assumptions regarding the informational efficiency of the market (for
example, swaption markets). Changes in correlation levels can have a major
impact, favorable or unfavorable, on the value of an instrument, depending
on its nature. A change in the default correlation of the fair value of the
underlying bonds comprising a CDO structure would affect the fair value of
the senior tranche. For example, an increase in the default correlation of the
underlying bonds would reduce the fair value of the senior tranche, because
highly correlated instruments produce larger losses in the event of default
and a part of these losses would become attributable to the senior tranche.
That same change in default correlation would have a different impact on
junior tranches of the same structure.
Volatility
Volatility represents the speed and severity of market price changes and is
a key factor in pricing options. Typically, instruments can become more
expensive if volatility increases. For example, as an index becomes more
volatile, the cost to Citi of maintaining a given level of exposure increases
because more frequent rebalancing of the portfolio is required. Volatility
generally depends on the tenor of the underlying instrument and the strike
price or level defined in the contract. Volatilities for certain combinations
of tenor and strike are not observable. The general relationship between
changes in the value of a portfolio to changes in volatility also depends on
changes in interest rates and the level of the underlying index. Generally,
long option positions (assets) benefit from increases in volatility, whereas
short option positions (liabilities) will suffer losses. Some instruments are
more sensitive to changes in volatility than others. For example, an at-the-
money option would experience a larger percentage change in its fair value
than a deep-in-the-money option. In addition, the fair value of an option
with more than one underlying security (for example, an option on a basket
of bonds) depends on the volatility of the individual underlying securities as
well as their correlations.
Yield
Adjusted yield is generally used to discount the projected future principal and
interest cash flows on instruments, such as asset-backed securities. Adjusted
yield is impacted by changes in the interest rate environment and relevant
credit spreads.