Citibank 2012 Annual Report Download - page 128
Download and view the complete annual report
Please find page 128 of the 2012 Citibank annual report below. You can navigate through the pages in the report by either clicking on the pages listed below, or by using the keyword search tool below to find specific information within the annual report.-
 1
1 -
2
-
3
-
4
-
5
-
6
-
7
-
8
-
9
-
10
-
11
-
12
-
13
-
14
-
15
-
16
-
17
-
18
-
19
-
20
-
21
-
22
-
23
-
24
-
25
-
26
-
27
-
28
-
29
-
30
-
31
-
32
-
33
-
34
-
35
-
36
-
37
-
38
-
39
-
40
-
41
-
42
-
43
-
44
-
45
-
46
-
47
-
48
-
49
-
50
-
51
-
52
-
53
-
54
-
55
-
56
-
57
-
58
-
59
-
60
-
61
-
62
-
63
-
64
-
65
-
66
-
67
-
68
-
69
-
70
-
71
-
72
-
73
-
74
-
75
-
76
-
77
-
78
-
79
-
80
-
81
-
82
-
83
-
84
-
85
-
86
-
87
-
88
-
89
-
90
-
91
-
92
-
93
-
94
-
95
-
96
-
97
-
98
-
99
-
100
-
101
-
102
-
103
-
104
-
105
-
106
-
107
-
108
-
109
-
110
-
111
-
112
-
113
-
114
-
115
-
116
-
117
-
 118
118 -
 119
119 -
 120
120 -
 121
121 -
 122
122 -
 123
123 -
 124
124 -
 125
125 -
 126
126 -
 127
127 -
 128
128 -
 129
129 -
 130
130 -
 131
131 -
 132
132 -
 133
133 -
 134
134 -
 135
135 -
 136
136 -
 137
137 -
 138
138 -
139
-
140
-
141
-
142
-
143
-
144
-
145
-
146
-
147
-
148
-
149
-
150
-
151
-
152
-
153
-
154
-
155
-
156
-
157
-
158
-
159
-
160
-
161
-
162
-
163
-
164
-
165
-
166
-
167
-
168
-
169
-
170
-
171
-
172
-
173
-
174
-
175
-
176
-
177
-
178
-
179
-
180
-
181
-
182
-
183
-
184
-
185
-
186
-
187
-
188
-
189
-
190
-
191
-
192
-
193
-
194
-
195
-
196
-
197
-
198
-
199
-
200
-
201
-
202
-
203
-
204
-
205
-
206
-
207
-
208
-
209
-
210
-
211
-
212
-
213
-
214
-
215
-
216
-
217
-
218
-
219
-
220
-
221
-
222
-
223
-
224
-
225
-
226
-
227
-
228
-
229
-
230
-
231
-
232
-
233
-
234
-
235
-
236
-
237
-
238
-
239
-
240
-
241
-
242
-
243
-
244
-
245
-
246
-
247
-
248
-
249
-
250
-
251
-
252
-
253
-
254
-
255
-
256
-
257
-
258
-
259
-
260
-
261
-
262
-
263
-
264
-
265
-
266
-
267
-
268
-
269
-
270
-
271
-
272
-
273
-
274
-
275
-
276
-
277
-
278
-
279
-
280
-
281
-
282
-
283
-
284
-
285
-
286
-
287
-
288
-
289
-
290
-
291
-
292
-
293
-
294
-
295
-
296
-
297
-
298
-
299
-
300
-
301
-
302
-
303
-
304
-
305
-
306
-
307
-
308
-
309
-
310
-
311
-
312
-
313
-
314
-
315
-
316
-
317
-
318
-
319
-
320
-
321
-
322
-
323
-
324
 |
 |
106
disclosure purposes, these differences are due to the fact that certain positions
included for external market risk purposes are not eligible for market risk
treatment under the U.S. regulatory capital rules, either as currently in effect
under Basel I or under the final market risk capital rules under Basel II.5/III
(e.g., the interest rate sensitivity of repos and reverse repos and the credit
and market sensitivities of the derivatives CVA are included for external
market risk disclosure purposes, but are not included for regulatory capital
purposes). The applicability of the VAR model for positions eligible for market
risk treatment under U.S. regulatory capital rules is periodically reviewed and
approved by Citi’s U.S. banking regulators.
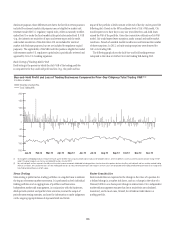
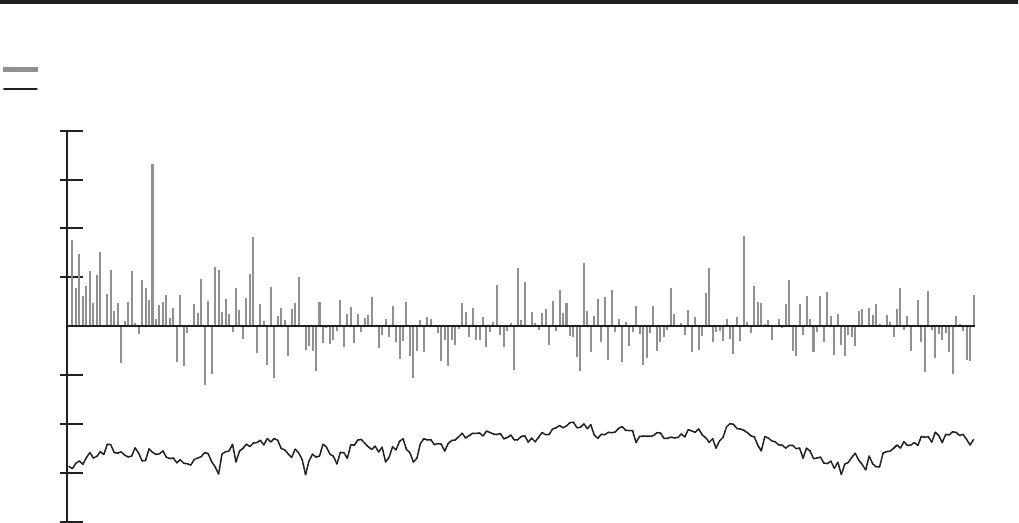
Back-Testing of Trading Market Risk
Back-testing is the process in which the daily VAR of the trading portfolio
is compared to the buy-and-hold profit and loss (e.g., the profit and loss
impact if the portfolio is held constant at the end of the day and re-priced the
following day). Based on the 99% confidence level of Citi’s VAR model, Citi
would expect two to three days in any one year where buy-and-hold losses
exceed the VAR of the portfolio. Given the conservative calibration of its VAR
model, Citi would expect fewer exceptions under normal and stable market
conditions. Periods of unstable market conditions could increase the number
of these exceptions. In 2012, no back-testing exceptions were observed for
Citi’s total trading VAR.
The following graph shows the daily buy-and-hold trading revenue
compared to the value at risk for Citi’s total trading VAR during 2012.
Buy-and-Hold Profit and Loss of Trading Businesses Compared to Prior-Day Citigroup Total Trading VAR(1)(2)
In millions of dollars
-200
-150
-100
-50
0
50
100
150
200
Total Buy-and-hold P&L
Total Trading VAR
Jan-12 Feb-12 Mar-12 Apr-12 May-12 Jun-12 Jul-12 Aug-12 Sep-12 Oct-12 Nov-12 Dec-12
(1) Citi changed its methodology for back-testing in the fourth quarter of 2012 from using actual profit and loss to buy-and-hold profit and loss, which Citi believes is more accurate for purposes of back-testing the VAR
model. The above histogram uses the buy-and-hold profit and loss for all of 2012.
(2) Buy-and-hold profit and loss represents the daily mark-to-market revenue movement attributable to trading positions from the close of the previous business day. Buy-and-hold profit and loss excludes realized trading
revenue, net interest, fees and commissions, intra-day trading profit and loss on new and terminated trades and changes in reserves and is not comparable to the trading-related revenue presented in the histogram of
Daily Trading-Related Revenue set forth above.
Stress Testing
Stress testing is performed on trading portfolios on a regular basis to estimate
the impact of extreme market movements. It is performed on both individual
trading portfolios and on aggregations of portfolios and businesses.
Independent market risk management, in conjunction with the businesses,
develops both systemic and specific stress scenarios, reviews the output of
periodic stress-testing exercises, and uses the information to make judgments
on the ongoing appropriateness of exposure levels and limits.
Factor Sensitivities
Factor sensitivities are expressed as the change in the value of a position for
a defined change in a market risk factor, such as a change in the value of a
Treasury bill for a one-basis-point change in interest rates. Citi’s independent
market risk management ensures that factor sensitivities are calculated,
monitored, and in most cases, limited, for all relevant risks taken in a
trading portfolio.