Citibank 2012 Annual Report Download - page 253
Download and view the complete annual report
Please find page 253 of the 2012 Citibank annual report below. You can navigate through the pages in the report by either clicking on the pages listed below, or by using the keyword search tool below to find specific information within the annual report.-
 1
1 -
2
-
3
-
4
-
5
-
6
-
7
-
8
-
9
-
10
-
11
-
12
-
13
-
14
-
15
-
16
-
17
-
18
-
19
-
20
-
21
-
22
-
23
-
24
-
25
-
26
-
27
-
28
-
29
-
30
-
31
-
32
-
33
-
34
-
35
-
36
-
37
-
38
-
39
-
40
-
41
-
42
-
43
-
44
-
45
-
46
-
47
-
48
-
49
-
50
-
51
-
52
-
53
-
54
-
55
-
56
-
57
-
58
-
59
-
60
-
61
-
62
-
63
-
64
-
65
-
66
-
67
-
68
-
69
-
70
-
71
-
72
-
73
-
74
-
75
-
76
-
77
-
78
-
79
-
80
-
81
-
82
-
83
-
84
-
85
-
86
-
87
-
88
-
89
-
90
-
91
-
92
-
93
-
94
-
95
-
96
-
97
-
98
-
99
-
100
-
101
-
102
-
103
-
104
-
105
-
106
-
107
-
108
-
109
-
110
-
111
-
112
-
113
-
114
-
115
-
116
-
117
-
118
-
119
-
120
-
121
-
122
-
123
-
124
-
125
-
126
-
127
-
128
-
129
-
130
-
131
-
132
-
133
-
134
-
135
-
136
-
137
-
138
-
139
-
140
-
141
-
142
-
143
-
144
-
145
-
146
-
147
-
148
-
149
-
150
-
151
-
152
-
153
-
154
-
155
-
156
-
157
-
158
-
159
-
160
-
161
-
162
-
163
-
164
-
165
-
166
-
167
-
168
-
169
-
170
-
171
-
172
-
173
-
174
-
175
-
176
-
177
-
178
-
179
-
180
-
181
-
182
-
183
-
184
-
185
-
186
-
187
-
188
-
189
-
190
-
191
-
192
-
193
-
194
-
195
-
196
-
197
-
198
-
199
-
200
-
201
-
202
-
203
-
204
-
205
-
206
-
207
-
208
-
209
-
210
-
211
-
212
-
213
-
214
-
215
-
216
-
217
-
218
-
219
-
220
-
221
-
222
-
223
-
224
-
225
-
226
-
227
-
228
-
229
-
230
-
231
-
232
-
233
-
234
-
235
-
236
-
237
-
238
-
239
-
240
-
241
-
242
-
 243
243 -
 244
244 -
 245
245 -
 246
246 -
 247
247 -
 248
248 -
 249
249 -
 250
250 -
 251
251 -
 252
252 -
 253
253 -
 254
254 -
 255
255 -
 256
256 -
 257
257 -
 258
258 -
 259
259 -
 260
260 -
 261
261 -
 262
262 -
 263
263 -
264
-
265
-
266
-
267
-
268
-
269
-
270
-
271
-
272
-
273
-
274
-
275
-
276
-
277
-
278
-
279
-
280
-
281
-
282
-
283
-
284
-
285
-
286
-
287
-
288
-
289
-
290
-
291
-
292
-
293
-
294
-
295
-
296
-
297
-
298
-
299
-
300
-
301
-
302
-
303
-
304
-
305
-
306
-
307
-
308
-
309
-
310
-
311
-
312
-
313
-
314
-
315
-
316
-
317
-
318
-
319
-
320
-
321
-
322
-
323
-
324
 |
 |

231
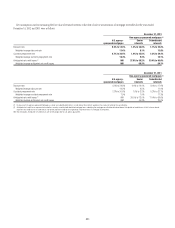
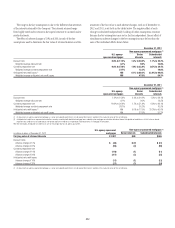
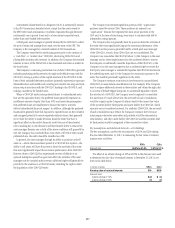
Key assumptions used in measuring the fair value of retained interests at the date of sale or securitization of mortgage receivables for the years ended
December 31, 2012 and 2011 were as follows:
December 31, 2012
Non-agency-sponsored mortgages (1)
U.S. agency-
sponsored mortgages
Senior
interests
Subordinated
interests
Discount rate 0.2% to 14.4% 1.2% to 24.0% 1.1% to 29.2%
Weighted average discount rate 11.4% 8.1% 13.8%
Constant prepayment rate 6.7% to 36.4% 1.9% to 22.8% 1.6% to 29.4%
Weighted average constant prepayment rate 10.2% 9.3% 10.1%
Anticipated net credit losses (2) NM 37.5% to 80.2% 33.4% to 90.0%
Weighted average anticipated net credit losses NM 60.3% 54.1%
December 31, 2011
Non-agency-sponsored mortgages (1)
U.S. agency-
sponsored mortgages
Senior
interests
Subordinated
interests
Discount rate 0.6% to 28.3% 2.4% to 10.0% 8.4% to 17.6%
Weighted average discount rate 12.0% 4.5% 11.0%
Constant prepayment rate 2.2% to 30.6% 1.0% to 2.2% 5.2% to 22.1%
Weighted average constant prepayment rate 7.9% 1.9% 17.3%
Anticipated net credit losses (2) NM 35.0% to 72.0% 11.4% to 58.6%
Weighted average anticipated net credit losses NM 45.3% 25.0%
(1) Disclosure of non-agency-sponsored mortgages as senior and subordinated interests is indicative of the interests’ position in the capital structure of the securitization.
(2) Anticipated net credit losses represent estimated loss severity associated with defaulted mortgage loans underlying the mortgage securitizations disclosed above. Anticipated net credit losses, in this instance, do not
represent total credit losses incurred to date, nor do they represent credit losses expected on retained interests in mortgage securitizations.
NM Not meaningful. Anticipated net credit losses are not meaningful due to U.S. agency guarantees.