Citibank 2012 Annual Report Download - page 260
Download and view the complete annual report
Please find page 260 of the 2012 Citibank annual report below. You can navigate through the pages in the report by either clicking on the pages listed below, or by using the keyword search tool below to find specific information within the annual report.-
 1
1 -
2
-
3
-
4
-
5
-
6
-
7
-
8
-
9
-
10
-
11
-
12
-
13
-
14
-
15
-
16
-
17
-
18
-
19
-
20
-
21
-
22
-
23
-
24
-
25
-
26
-
27
-
28
-
29
-
30
-
31
-
32
-
33
-
34
-
35
-
36
-
37
-
38
-
39
-
40
-
41
-
42
-
43
-
44
-
45
-
46
-
47
-
48
-
49
-
50
-
51
-
52
-
53
-
54
-
55
-
56
-
57
-
58
-
59
-
60
-
61
-
62
-
63
-
64
-
65
-
66
-
67
-
68
-
69
-
70
-
71
-
72
-
73
-
74
-
75
-
76
-
77
-
78
-
79
-
80
-
81
-
82
-
83
-
84
-
85
-
86
-
87
-
88
-
89
-
90
-
91
-
92
-
93
-
94
-
95
-
96
-
97
-
98
-
99
-
100
-
101
-
102
-
103
-
104
-
105
-
106
-
107
-
108
-
109
-
110
-
111
-
112
-
113
-
114
-
115
-
116
-
117
-
118
-
119
-
120
-
121
-
122
-
123
-
124
-
125
-
126
-
127
-
128
-
129
-
130
-
131
-
132
-
133
-
134
-
135
-
136
-
137
-
138
-
139
-
140
-
141
-
142
-
143
-
144
-
145
-
146
-
147
-
148
-
149
-
150
-
151
-
152
-
153
-
154
-
155
-
156
-
157
-
158
-
159
-
160
-
161
-
162
-
163
-
164
-
165
-
166
-
167
-
168
-
169
-
170
-
171
-
172
-
173
-
174
-
175
-
176
-
177
-
178
-
179
-
180
-
181
-
182
-
183
-
184
-
185
-
186
-
187
-
188
-
189
-
190
-
191
-
192
-
193
-
194
-
195
-
196
-
197
-
198
-
199
-
200
-
201
-
202
-
203
-
204
-
205
-
206
-
207
-
208
-
209
-
210
-
211
-
212
-
213
-
214
-
215
-
216
-
217
-
218
-
219
-
220
-
221
-
222
-
223
-
224
-
225
-
226
-
227
-
228
-
229
-
230
-
231
-
232
-
233
-
234
-
235
-
236
-
237
-
238
-
239
-
240
-
241
-
242
-
243
-
244
-
245
-
246
-
247
-
248
-
249
-
 250
250 -
 251
251 -
 252
252 -
 253
253 -
 254
254 -
 255
255 -
 256
256 -
 257
257 -
 258
258 -
 259
259 -
 260
260 -
 261
261 -
 262
262 -
 263
263 -
 264
264 -
 265
265 -
 266
266 -
 267
267 -
 268
268 -
 269
269 -
 270
270 -
271
-
272
-
273
-
274
-
275
-
276
-
277
-
278
-
279
-
280
-
281
-
282
-
283
-
284
-
285
-
286
-
287
-
288
-
289
-
290
-
291
-
292
-
293
-
294
-
295
-
296
-
297
-
298
-
299
-
300
-
301
-
302
-
303
-
304
-
305
-
306
-
307
-
308
-
309
-
310
-
311
-
312
-
313
-
314
-
315
-
316
-
317
-
318
-
319
-
320
-
321
-
322
-
323
-
324
 |
 |

238
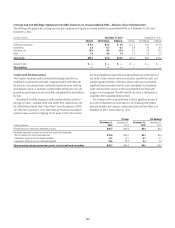
Asset-Based Financing
The Company provides loans and other forms of financing to VIEs that
hold assets. Those loans are subject to the same credit approvals as all
other loans originated or purchased by the Company. Financings in the
form of debt securities or derivatives are, in most circumstances, reported in
Trading account assets and accounted for at fair value through earnings.
The Company generally does not have the power to direct the activities that
most significantly impact these VIEs’ economic performance and thus it does
not consolidate them.
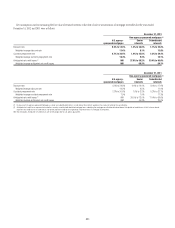
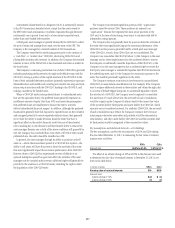
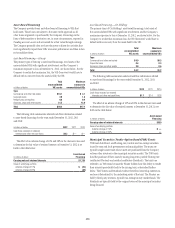
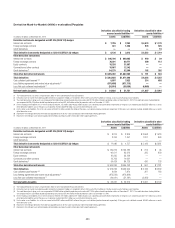
Asset-Based Financing—Citicorp
The primary types of Citicorp’s asset-based financings, total assets of the
unconsolidated VIEs with significant involvement and the Company’s
maximum exposure to loss at December 31, 2012, are shown below. For the
Company to realize that maximum loss, the VIE (borrower) would have to
default with no recovery from the assets held by the VIE.
In billions of dollars
Total
unconsolidated
VIE assets
Maximum
exposure to
unconsolidated VIEs
Type
Commercial and other real estate $16.1 $ 3.1
Corporate loans 2.0 1.6
Hedge funds and equities 0.6 0.4
Airplanes, ships and other assets 21.5 12.0
Total $40.2 $17.1
The following table summarizes selected cash flow information related
to asset-based financings for the years ended December 31, 2012, 2011
and 2010:
In billions of dollars 2012 2011 2010
Cash flows received on retained
interests and other net cash flows $0.3 $— $—
The effect of an adverse change of 10% and 20% in the discount rates used
to determine the fair value of retained interests at December 31, 2012 is set
forth in the table below:
In millions of dollars
Asset-based
Financing
Carrying value of retained interests $1,726
Value of underlying portfolio
Adverse change of 10% $ (22)
Adverse change of 20% (44)
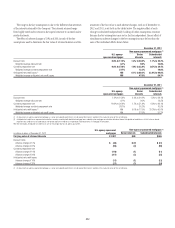
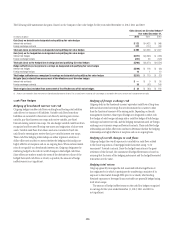
Asset-Based Financing—Citi Holdings
The primary types of Citi Holdings’ asset-based financings, total assets of
the unconsolidated VIEs with significant involvement and the Company’s
maximum exposure to loss at December 31, 2012, are shown below. For the
Company to realize that maximum loss, the VIE (borrower) would have to
default with no recovery from the assets held by the VIE.
In billions of dollars
Total
unconsolidated
VIE assets
Maximum
exposure to
unconsolidated VIEs
Type
Commercial and other real estate $0.9 $0.3
Corporate loans 0.4 0.3
Airplanes, ships and other assets 2.9 0.6
Total $4.2 $1.2
The following table summarizes selected cash flow information related
to asset-based financings for the years ended December 31, 2012, 2011
and 2010:
In billions of dollars 2012 2011 2010
Cash flows received on retained
interests and other net cash flows $1.7 $1.4 $2.8
The effect of an adverse change of 10% and 20% in the discount rates used
to determine the fair value of retained interests at December 31, 2012 is set
forth in the table below:
In millions of dollars
Asset-based
Financing
Carrying value of retained interests $339
Value of underlying portfolio
Adverse change of 10% $ —
Adverse change of 20% —
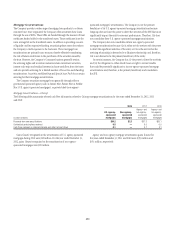
Municipal Securities Tender Option Bond (TOB) Trusts
TOB trusts hold fixed- and floating-rate, taxable and tax-exempt securities
issued by state and local governments and municipalities. The trusts are
typically single-issuer trusts whose assets are purchased from the Company
or from other investors in the municipal securities market. The TOB trusts
fund the purchase of their assets by issuing long-term, putable floating rate
certificates (Floaters) and residual certificates (Residuals). The trusts are
referred to as TOB trusts because the Floater holders have the ability to tender
their interests periodically back to the issuing trust, as described further
below. The Floaters and Residuals evidence beneficial ownership interests in,
and are collateralized by, the underlying assets of the trust. The Floaters are
held by third-party investors, typically tax-exempt money market funds. The
Residuals are typically held by the original owner of the municipal securities
being financed.