Citibank 2012 Annual Report Download - page 73
Download and view the complete annual report
Please find page 73 of the 2012 Citibank annual report below. You can navigate through the pages in the report by either clicking on the pages listed below, or by using the keyword search tool below to find specific information within the annual report.-
 1
1 -
2
-
3
-
4
-
5
-
6
-
7
-
8
-
9
-
10
-
11
-
12
-
13
-
14
-
15
-
16
-
17
-
18
-
19
-
20
-
21
-
22
-
23
-
24
-
25
-
26
-
27
-
28
-
29
-
30
-
31
-
32
-
33
-
34
-
35
-
36
-
37
-
38
-
39
-
40
-
41
-
42
-
43
-
44
-
45
-
46
-
47
-
48
-
49
-
50
-
51
-
52
-
53
-
54
-
55
-
56
-
57
-
58
-
59
-
60
-
61
-
62
-
 63
63 -
 64
64 -
 65
65 -
 66
66 -
 67
67 -
 68
68 -
 69
69 -
 70
70 -
 71
71 -
 72
72 -
 73
73 -
 74
74 -
 75
75 -
 76
76 -
 77
77 -
 78
78 -
 79
79 -
 80
80 -
 81
81 -
 82
82 -
 83
83 -
84
-
85
-
86
-
87
-
88
-
89
-
90
-
91
-
92
-
93
-
94
-
95
-
96
-
97
-
98
-
99
-
100
-
101
-
102
-
103
-
104
-
105
-
106
-
107
-
108
-
109
-
110
-
111
-
112
-
113
-
114
-
115
-
116
-
117
-
118
-
119
-
120
-
121
-
122
-
123
-
124
-
125
-
126
-
127
-
128
-
129
-
130
-
131
-
132
-
133
-
134
-
135
-
136
-
137
-
138
-
139
-
140
-
141
-
142
-
143
-
144
-
145
-
146
-
147
-
148
-
149
-
150
-
151
-
152
-
153
-
154
-
155
-
156
-
157
-
158
-
159
-
160
-
161
-
162
-
163
-
164
-
165
-
166
-
167
-
168
-
169
-
170
-
171
-
172
-
173
-
174
-
175
-
176
-
177
-
178
-
179
-
180
-
181
-
182
-
183
-
184
-
185
-
186
-
187
-
188
-
189
-
190
-
191
-
192
-
193
-
194
-
195
-
196
-
197
-
198
-
199
-
200
-
201
-
202
-
203
-
204
-
205
-
206
-
207
-
208
-
209
-
210
-
211
-
212
-
213
-
214
-
215
-
216
-
217
-
218
-
219
-
220
-
221
-
222
-
223
-
224
-
225
-
226
-
227
-
228
-
229
-
230
-
231
-
232
-
233
-
234
-
235
-
236
-
237
-
238
-
239
-
240
-
241
-
242
-
243
-
244
-
245
-
246
-
247
-
248
-
249
-
250
-
251
-
252
-
253
-
254
-
255
-
256
-
257
-
258
-
259
-
260
-
261
-
262
-
263
-
264
-
265
-
266
-
267
-
268
-
269
-
270
-
271
-
272
-
273
-
274
-
275
-
276
-
277
-
278
-
279
-
280
-
281
-
282
-
283
-
284
-
285
-
286
-
287
-
288
-
289
-
290
-
291
-
292
-
293
-
294
-
295
-
296
-
297
-
298
-
299
-
300
-
301
-
302
-
303
-
304
-
305
-
306
-
307
-
308
-
309
-
310
-
311
-
312
-
313
-
314
-
315
-
316
-
317
-
318
-
319
-
320
-
321
-
322
-
323
-
324
 |
 |

51
of England, Swiss National Bank, Bank of Japan, the Monetary Authority
of Singapore and the Hong Kong Monetary Authority), compared with
$72.7 billion at September 30, 2012 and $70.7 billion at December 31, 2011.
The significant Citibank entities’ liquidity resources amount as of
December 31, 2012 also included unencumbered liquid securities. These
securities are available-for-sale or secured financing through private markets
or by pledging to the major central banks. The liquidity value of these securities
was $173.3 billion at December 31, 2012 compared to $164.0 billion at
September 30, 2012 and $129.5 billion at December 31, 2011.
Citi estimates that its other Citibank and Banamex entities and
subsidiaries held approximately $89.5 billion in aggregate liquidity resources
as of December 31, 2012, compared to $89.8 billion at September 30, 2012
and $106.9 billion at December 31, 2011. The decrease year-over-year was
primarily due to increased lending and limited deposit growth in those
entities. The $89.5 billion as of December 31, 2012 included $13.3 billion
of cash on deposit with central banks and $76.2 billion of unencumbered
liquid securities.
Citi’s $353.8 billion of aggregate liquidity resources as of December 31,
2012 does not include additional potential liquidity in the form of Citigroup’s
borrowing capacity from the various Federal Home Loan Banks (FHLB),
which was approximately $36.7 billion as of December 31, 2012 and is
maintained by pledged collateral to all such banks. The aggregate liquidity
resources shown above also do not include Citi’s borrowing capacity at the
U.S. Federal Reserve Bank discount window or international central banks,
which capacity would also be in addition to the resources noted above.
Moreover, in general, Citigroup can freely fund legal entities within
its bank vehicles. Citigroup’s bank subsidiaries, including Citibank, N.A.,
can lend to the Citigroup parent and broker-dealer entities in accordance
with Section 23A of the Federal Reserve Act. As of December 31, 2012,
the amount available for lending to these non-bank entities under
Section 23A was approximately $15 billion, provided the funds are
collateralized appropriately.
Overall, subject to market conditions, Citi expects to continue to modestly
manage down its aggregate liquidity resources as it continues to pay down
or allow its outstanding long-term debt to mature (see “Long-Term Debt”
below).
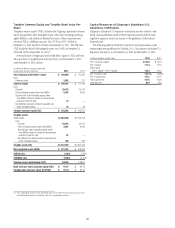
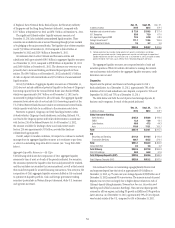
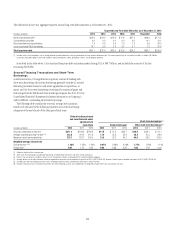
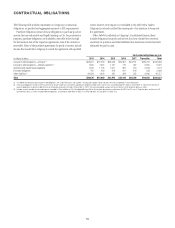
Aggregate Liquidity Resources—By Type
The following table shows the composition of Citi’s aggregate liquidity
resources by type of asset as of each of the periods indicated. For securities,
the amounts represent the liquidity value that could potentially be realized,
and thus excludes any securities that are encumbered, as well as the haircuts
that would be required for secured financing transactions. Year-over-year, the
composition of Citi’s aggregate liquidity resources shifted as Citi continued
to optimize its liquidity portfolio. Cash and foreign government trading
securities (particularly in Western Europe) decreased, while U.S. treasuries
and agencies increased.
In billions of dollars
Dec. 31,
2012
Sept. 30,
2012
Dec. 31,
2011
Available cash at central banks $ 73.0 $139.5 $ 127.4
U.S. Treasuries 89.0 73.0 67.0
U.S. Agencies/Agency MBS 72.5 67.0 68.9
Foreign Government (1) 111.7 119.5 136.6
Other Investment Grade 7.6 5.2 5.6
Total $353.8 $404.2 $405.5
(1) Foreign government also includes foreign government agencies, multinationals and foreign
government guaranteed securities. Foreign government securities are held largely to support local
liquidity requirements and Citi’s local franchises and, as of December 31, 2012, principally included
government bonds from Korea, Japan, Mexico, Brazil, Hong Kong, Singapore and Taiwan.
The aggregate liquidity resources are composed entirely of cash and
securities positions. While Citi utilizes derivatives to manage the interest
rate and currency risks related to the aggregate liquidity resources, credit
derivatives are not used.
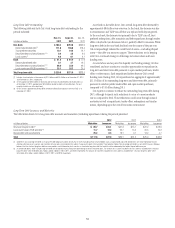
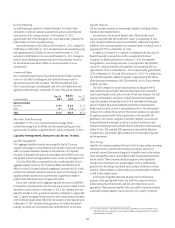
Deposits
Deposits are the primary and lowest cost funding source for Citi’s
bank subsidiaries. As of December 31, 2012, approximately 78% of the
liabilities of Citi’s bank subsidiaries were deposits, compared to 76% as of
September 30, 2012 and 75% as of December 31, 2011.
The table below sets forth the end of period and average deposits, by
business and/or segment, for each of the periods indicated.
In billions of dollars
Dec. 31,
2012
Sept. 30,
2012
Dec. 31,
2011
Global Consumer Banking
North America $165.2 $156.8 $ 149.0
EMEA 13.2 12.9 12.1
Latin America 48.6 47.3 44.3
Asia 110.0 113.1 109.7
Total $337.0 $330.1 $315.1
ICG
Securities and Banking $114.4 $119.4 $ 110.9
Transaction Services 408.7 425.5 373.1
Total $523.1 $544.9 $484.0
Corporate/Other 2.5 2.8 5.2
Total Citicorp $862.6 $877.8 $ 804.3
Total Citi Holdings 68.0 66.8 61.6
Total Citigroup Deposits (EOP) $930.6 $944.6 $865.9
Total Citigroup Deposits (AVG) $928.9 $921.2 $ 857.0
Citi continued to focus on maintaining a geographically diverse retail
and corporate deposit base that stood at approximately $931 billion at
December 31, 2012, up 7% year-over-year. Average deposits of $929 billion as of
December 31, 2012 increased 8% year-over-year. The increase in end-of-period
deposits year-over-year was largely due to higher deposit volumes in each of
Citicorp’s deposit-taking businesses (Transaction Services, Securities and
Banking and Global Consumer Banking). Year-over-year deposit growth
occurred in all four regions, including 9% growth in EMEA and 10% growth in
Latin America. As of December 31, 2012, approximately 59% of Citi’s deposits
were located outside of the U.S., compared to 61% at December 31, 2011.