Citibank 2012 Annual Report Download - page 191
Download and view the complete annual report
Please find page 191 of the 2012 Citibank annual report below. You can navigate through the pages in the report by either clicking on the pages listed below, or by using the keyword search tool below to find specific information within the annual report.-
 1
1 -
2
-
3
-
4
-
5
-
6
-
7
-
8
-
9
-
10
-
11
-
12
-
13
-
14
-
15
-
16
-
17
-
18
-
19
-
20
-
21
-
22
-
23
-
24
-
25
-
26
-
27
-
28
-
29
-
30
-
31
-
32
-
33
-
34
-
35
-
36
-
37
-
38
-
39
-
40
-
41
-
42
-
43
-
44
-
45
-
46
-
47
-
48
-
49
-
50
-
51
-
52
-
53
-
54
-
55
-
56
-
57
-
58
-
59
-
60
-
61
-
62
-
63
-
64
-
65
-
66
-
67
-
68
-
69
-
70
-
71
-
72
-
73
-
74
-
75
-
76
-
77
-
78
-
79
-
80
-
81
-
82
-
83
-
84
-
85
-
86
-
87
-
88
-
89
-
90
-
91
-
92
-
93
-
94
-
95
-
96
-
97
-
98
-
99
-
100
-
101
-
102
-
103
-
104
-
105
-
106
-
107
-
108
-
109
-
110
-
111
-
112
-
113
-
114
-
115
-
116
-
117
-
118
-
119
-
120
-
121
-
122
-
123
-
124
-
125
-
126
-
127
-
128
-
129
-
130
-
131
-
132
-
133
-
134
-
135
-
136
-
137
-
138
-
139
-
140
-
141
-
142
-
143
-
144
-
145
-
146
-
147
-
148
-
149
-
150
-
151
-
152
-
153
-
154
-
155
-
156
-
157
-
158
-
159
-
160
-
161
-
162
-
163
-
164
-
165
-
166
-
167
-
168
-
169
-
170
-
171
-
172
-
173
-
174
-
175
-
176
-
177
-
178
-
179
-
180
-
 181
181 -
 182
182 -
 183
183 -
 184
184 -
 185
185 -
 186
186 -
 187
187 -
 188
188 -
 189
189 -
 190
190 -
 191
191 -
 192
192 -
 193
193 -
 194
194 -
 195
195 -
 196
196 -
 197
197 -
 198
198 -
 199
199 -
 200
200 -
 201
201 -
202
-
203
-
204
-
205
-
206
-
207
-
208
-
209
-
210
-
211
-
212
-
213
-
214
-
215
-
216
-
217
-
218
-
219
-
220
-
221
-
222
-
223
-
224
-
225
-
226
-
227
-
228
-
229
-
230
-
231
-
232
-
233
-
234
-
235
-
236
-
237
-
238
-
239
-
240
-
241
-
242
-
243
-
244
-
245
-
246
-
247
-
248
-
249
-
250
-
251
-
252
-
253
-
254
-
255
-
256
-
257
-
258
-
259
-
260
-
261
-
262
-
263
-
264
-
265
-
266
-
267
-
268
-
269
-
270
-
271
-
272
-
273
-
274
-
275
-
276
-
277
-
278
-
279
-
280
-
281
-
282
-
283
-
284
-
285
-
286
-
287
-
288
-
289
-
290
-
291
-
292
-
293
-
294
-
295
-
296
-
297
-
298
-
299
-
300
-
301
-
302
-
303
-
304
-
305
-
306
-
307
-
308
-
309
-
310
-
311
-
312
-
313
-
314
-
315
-
316
-
317
-
318
-
319
-
320
-
321
-
322
-
323
-
324
 |
 |
169
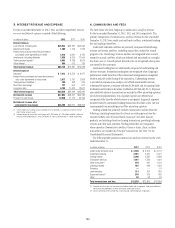
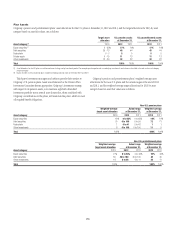
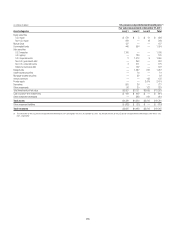
Information with respect to stock option activity under Citigroup stock option programs for the years ended December 31, 2012, 2011 and 2010 is as follows:
2012 2011 2010
Options
Weighted-
average
exercise
price
Intrinsic
value
per share Options
Weighted-
average
exercise
price
Intrinsic
value
per share Options
Weighted-
average
exercise
price
Intrinsic
value
per share
Outstanding, beginning of period 37,596,029 $ 69.60 $— 37,486,011 $ 93.70 $ — 40,404,481 $127.50 $ —
Granted—original — — — 3,425,000 48.86 — 4,450,017 47.80 —
Forfeited or exchanged (858,906) 83.84 — (1,539,227) 176.41 — (4,368,086) 115.10 —
Expired (1,716,726) 438.14 — (1,610,450) 487.24 — (2,935,863) 458.70 —
Exercised — — — (165,305) 40.80 6.72 (64,538) 40.80 3.80
Outstanding, end of period 35,020,397 $ 51.20 $— 37,596,029 $ 69.60 $ — 37,486,011 $ 93.70 $ —
Exercisable, end of period 32,973,444 23,237,069 15,189,710
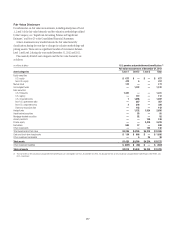
The following table summarizes the information about stock options outstanding under Citigroup stock option programs at December 31, 2012:
Options outstanding Options exercisable
Range of exercise prices
Number
outstanding
Weighted-average
contractual life
remaining
Weighted-average
exercise price
Number
exercisable
Weighted-average
exercise price
$29.70–$49.99 (1) 33,392,541 3.1 years $ 42.40 31,431,666 $ 42.02
$50.00–$99.99 69,956 8.1 years 56.76 69,132 56.64
$100.00–$199.99 516,577 5.9 years 147.33 431,323 148.33
$200.00–$299.99 754,375 1.7 years 243.85 754,375 243.85
$300.00–$399.99 206,627 4.9 years 335.97 206,627 335.97
$400.00–$557.00 80,321 0.1 years 543.69 80,321 543.69
Total at December 31, 2012 35,020,397 3.1 years $ 51.20 32,973,444 $ 51.13
(1) A significant portion of the outstanding options are in the $40 to $45 range of exercise prices.
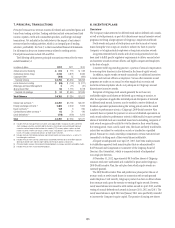
As of December 31, 2012, there was $8.7 million of total unrecognized
compensation cost related to stock options; this cost is expected to be
recognized over a weighted-average period of 0.3 years. Valuation and related
assumption information for Citigroup option programs is presented below.
Citigroup uses a lattice-type model to value stock options.
For options granted during 2012 2011 2010
Weighted-average per-share fair value,
at December 31 N/A $ 13.90 $ 16.60
Weighted-average expected life
Original grants N/A 4.95 yrs. 6.06 yrs.
Valuation assumptions
Expected volatility N/A 35.64% 36.42%
Risk-free interest rate N/A 2.33% 2.88%
Expected dividend yield N/A 0.00% 0.00%
Expected annual forfeitures
Original and reload grants N/A 9.62% 9.62%
N/A Not applicable