Citibank 2012 Annual Report Download - page 32
Download and view the complete annual report
Please find page 32 of the 2012 Citibank annual report below. You can navigate through the pages in the report by either clicking on the pages listed below, or by using the keyword search tool below to find specific information within the annual report.-
 1
1 -
2
-
3
-
4
-
5
-
6
-
7
-
8
-
9
-
10
-
11
-
12
-
13
-
14
-
15
-
16
-
17
-
18
-
19
-
20
-
21
-
 22
22 -
 23
23 -
 24
24 -
 25
25 -
 26
26 -
 27
27 -
 28
28 -
 29
29 -
 30
30 -
 31
31 -
 32
32 -
 33
33 -
 34
34 -
 35
35 -
 36
36 -
 37
37 -
 38
38 -
 39
39 -
 40
40 -
 41
41 -
 42
42 -
43
-
44
-
45
-
46
-
47
-
48
-
49
-
50
-
51
-
52
-
53
-
54
-
55
-
56
-
57
-
58
-
59
-
60
-
61
-
62
-
63
-
64
-
65
-
66
-
67
-
68
-
69
-
70
-
71
-
72
-
73
-
74
-
75
-
76
-
77
-
78
-
79
-
80
-
81
-
82
-
83
-
84
-
85
-
86
-
87
-
88
-
89
-
90
-
91
-
92
-
93
-
94
-
95
-
96
-
97
-
98
-
99
-
100
-
101
-
102
-
103
-
104
-
105
-
106
-
107
-
108
-
109
-
110
-
111
-
112
-
113
-
114
-
115
-
116
-
117
-
118
-
119
-
120
-
121
-
122
-
123
-
124
-
125
-
126
-
127
-
128
-
129
-
130
-
131
-
132
-
133
-
134
-
135
-
136
-
137
-
138
-
139
-
140
-
141
-
142
-
143
-
144
-
145
-
146
-
147
-
148
-
149
-
150
-
151
-
152
-
153
-
154
-
155
-
156
-
157
-
158
-
159
-
160
-
161
-
162
-
163
-
164
-
165
-
166
-
167
-
168
-
169
-
170
-
171
-
172
-
173
-
174
-
175
-
176
-
177
-
178
-
179
-
180
-
181
-
182
-
183
-
184
-
185
-
186
-
187
-
188
-
189
-
190
-
191
-
192
-
193
-
194
-
195
-
196
-
197
-
198
-
199
-
200
-
201
-
202
-
203
-
204
-
205
-
206
-
207
-
208
-
209
-
210
-
211
-
212
-
213
-
214
-
215
-
216
-
217
-
218
-
219
-
220
-
221
-
222
-
223
-
224
-
225
-
226
-
227
-
228
-
229
-
230
-
231
-
232
-
233
-
234
-
235
-
236
-
237
-
238
-
239
-
240
-
241
-
242
-
243
-
244
-
245
-
246
-
247
-
248
-
249
-
250
-
251
-
252
-
253
-
254
-
255
-
256
-
257
-
258
-
259
-
260
-
261
-
262
-
263
-
264
-
265
-
266
-
267
-
268
-
269
-
270
-
271
-
272
-
273
-
274
-
275
-
276
-
277
-
278
-
279
-
280
-
281
-
282
-
283
-
284
-
285
-
286
-
287
-
288
-
289
-
290
-
291
-
292
-
293
-
294
-
295
-
296
-
297
-
298
-
299
-
300
-
301
-
302
-
303
-
304
-
305
-
306
-
307
-
308
-
309
-
310
-
311
-
312
-
313
-
314
-
315
-
316
-
317
-
318
-
319
-
320
-
321
-
322
-
323
-
324
 |
 |

10
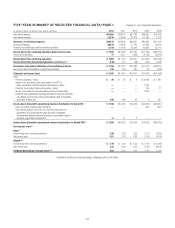
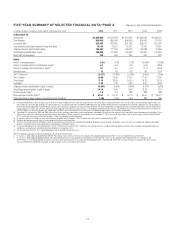
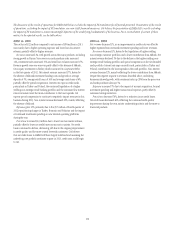
FIVE-YEAR SUMMARY OF SELECTED FINANCIAL DATA—PAGE 1 Citigroup Inc. and Consolidated Subsidiaries
In millions of dollars, except per-share amounts and ratios 2012 2011 2010 2009 2008
Net interest revenue $47,603 $48,447 $54,186 $48,496 $ 53,366
Non-interest revenue 22,570 29,906 32,415 31,789 (1,767)
Revenues, net of interest expense $70,173 $78,353 $86,601 $80,285 $ 51,599
Operating expenses 50,518 50,933 47,375 47,822 69,240
Provisions for credit losses and for benefits and claims 11,719 12,796 26,042 40,262 34,714
Income (loss) from continuing operations before income taxes $ 7,936 $14,624 $13,184 $ (7,799) $(52,355)
Income taxes (benefits) 27 3,521 2,233 (6,733) (20,326)
Income (loss) from continuing operations $ 7,909 $11,103 $10,951 $ (1,066) $(32,029)
Income (loss) from discontinued operations, net of taxes (1) (149) 112 (68) (445) 4,002
Net income (loss) before attribution of noncontrolling interests $ 7,760 $11,215 $10,883 $ (1,511) $(28,027)
Net income (loss) attributable to noncontrolling interests 219 148 281 95 (343)
Citigroup’s net income (loss) $ 7,541 $11,067 $10,602 $ (1,606) $(27,684)
Less:
Preferred dividends—Basic $ 26 $ 26 $ 9 $ 2,988 $ 1,695
Impact of the conversion price reset related to the $12.5
billion convertible preferred stock private issuance—Basic —— — 1,285 —
Preferred stock Series H discount accretion—Basic —— — 123 37
Impact of the public and private preferred stock exchange offers —— — 3,242 —
Dividends and undistributed earnings allocated to employee restricted
and deferred shares that contain nonforfeitable rights to dividends,
applicable to Basic EPS 166 186 90 2 221
Income (loss) allocated to unrestricted common shareholders for Basic EPS $ 7,349 $10,855 $10,503 $ (9,246) $(29,637)
Less: Convertible preferred stock dividends —— — (540) (877)
Add: Interest expense, net of tax, on convertible securities and
adjustment of undistributed earnings allocated to employee
restricted and deferred shares that contain nonforfeitable rights to
dividends, applicable to diluted EPS 11 17 2 — —
Income (loss) allocated to unrestricted common shareholders for diluted EPS (2) $ 7,360 $10,872 $10,505 $ (8,706) $(28,760)
Earnings per share (3)
Basic (3)
Income (loss) from continuing operations 2.56 3.69 3.66 (7.61) (63.89)
Net income (loss) 2.51 3.73 3.65 (7.99) (56.29)
Diluted (2)(3)
Income (loss) from continuing operations $ 2.49 $ 3.59 $ 3.55 $ (7.61) $ (63.89)
Net income (loss) 2.44 3.63 3.54 (7.99) (56.29)
Dividends declared per common share (3)(4) 0.04 0.03 0.00 0.10 11.20
Statement continues on the next page, including notes to the table.