Citibank 2012 Annual Report Download - page 293
Download and view the complete annual report
Please find page 293 of the 2012 Citibank annual report below. You can navigate through the pages in the report by either clicking on the pages listed below, or by using the keyword search tool below to find specific information within the annual report.-
 1
1 -
2
-
3
-
4
-
5
-
6
-
7
-
8
-
9
-
10
-
11
-
12
-
13
-
14
-
15
-
16
-
17
-
18
-
19
-
20
-
21
-
22
-
23
-
24
-
25
-
26
-
27
-
28
-
29
-
30
-
31
-
32
-
33
-
34
-
35
-
36
-
37
-
38
-
39
-
40
-
41
-
42
-
43
-
44
-
45
-
46
-
47
-
48
-
49
-
50
-
51
-
52
-
53
-
54
-
55
-
56
-
57
-
58
-
59
-
60
-
61
-
62
-
63
-
64
-
65
-
66
-
67
-
68
-
69
-
70
-
71
-
72
-
73
-
74
-
75
-
76
-
77
-
78
-
79
-
80
-
81
-
82
-
83
-
84
-
85
-
86
-
87
-
88
-
89
-
90
-
91
-
92
-
93
-
94
-
95
-
96
-
97
-
98
-
99
-
100
-
101
-
102
-
103
-
104
-
105
-
106
-
107
-
108
-
109
-
110
-
111
-
112
-
113
-
114
-
115
-
116
-
117
-
118
-
119
-
120
-
121
-
122
-
123
-
124
-
125
-
126
-
127
-
128
-
129
-
130
-
131
-
132
-
133
-
134
-
135
-
136
-
137
-
138
-
139
-
140
-
141
-
142
-
143
-
144
-
145
-
146
-
147
-
148
-
149
-
150
-
151
-
152
-
153
-
154
-
155
-
156
-
157
-
158
-
159
-
160
-
161
-
162
-
163
-
164
-
165
-
166
-
167
-
168
-
169
-
170
-
171
-
172
-
173
-
174
-
175
-
176
-
177
-
178
-
179
-
180
-
181
-
182
-
183
-
184
-
185
-
186
-
187
-
188
-
189
-
190
-
191
-
192
-
193
-
194
-
195
-
196
-
197
-
198
-
199
-
200
-
201
-
202
-
203
-
204
-
205
-
206
-
207
-
208
-
209
-
210
-
211
-
212
-
213
-
214
-
215
-
216
-
217
-
218
-
219
-
220
-
221
-
222
-
223
-
224
-
225
-
226
-
227
-
228
-
229
-
230
-
231
-
232
-
233
-
234
-
235
-
236
-
237
-
238
-
239
-
240
-
241
-
242
-
243
-
244
-
245
-
246
-
247
-
248
-
249
-
250
-
251
-
252
-
253
-
254
-
255
-
256
-
257
-
258
-
259
-
260
-
261
-
262
-
263
-
264
-
265
-
266
-
267
-
268
-
269
-
270
-
271
-
272
-
273
-
274
-
275
-
276
-
277
-
278
-
279
-
280
-
281
-
282
-
 283
283 -
 284
284 -
 285
285 -
 286
286 -
 287
287 -
 288
288 -
 289
289 -
 290
290 -
 291
291 -
 292
292 -
 293
293 -
 294
294 -
 295
295 -
 296
296 -
 297
297 -
 298
298 -
 299
299 -
 300
300 -
 301
301 -
 302
302 -
 303
303 -
304
-
305
-
306
-
307
-
308
-
309
-
310
-
311
-
312
-
313
-
314
-
315
-
316
-
317
-
318
-
319
-
320
-
321
-
322
-
323
-
324
 |
 |

271
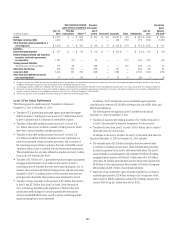
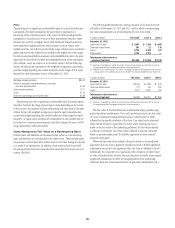
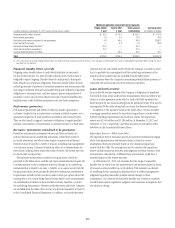
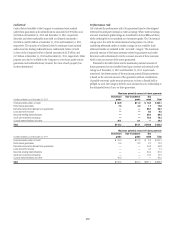
The following table provides information about certain credit products carried at fair value at December 31, 2012 and 2011:
December 31, 2012 December 31, 2011
In millions of dollars Trading assets Loans Trading assets Loans
Carrying amount reported on the Consolidated Balance Sheet $11,658 $3,893 $14,150 $ 3,735
Aggregate unpaid principal balance in excess of (less than) fair value 31 (132) 540 (54)
Balance of non-accrual loans or loans more than 90 days past due 104 — 134 —
Aggregate unpaid principal balance in excess of fair value for non-accrual
loans or loans more than 90 days past due 85 — 43 —
In addition to the amounts reported above, $1,891 million and
$648 million of unfunded loan commitments related to certain credit
products selected for fair value accounting were outstanding as of
December 31, 2012 and 2011, respectively.
Changes in fair value of funded and unfunded credit products are
classified in Principal transactions in the Company’s Consolidated
Statement of Income. Related interest revenue is measured based on the
contractual interest rates and reported as Interest revenue on Trading
account assets or loan interest depending on the balance sheet classifications
of the credit products. The changes in fair value for the years ended
December 31, 2012 and 2011 due to instrument-specific credit risk totaled to
a gain of $39 million and $53 million, respectively.
Certain investments in private equity and real estate
ventures and certain equity method investments
Citigroup invests in private equity and real estate ventures for the purpose
of earning investment returns and for capital appreciation. The Company
has elected the fair value option for certain of these ventures, because such
investments are considered similar to many private equity or hedge fund
activities in Citi’s investment companies, which are reported at fair value.
The fair value option brings consistency in the accounting and evaluation of
these investments. All investments (debt and equity) in such private equity
and real estate entities are accounted for at fair value. These investments are
classified as Investments on Citigroup’s Consolidated Balance Sheet.
Citigroup also holds various non-strategic investments in leveraged
buyout funds and other hedge funds for which the Company elected fair
value accounting to reduce operational and accounting complexity. Since
the funds account for all of their underlying assets at fair value, the impact
of applying the equity method to Citigroup’s investment in these funds was
equivalent to fair value accounting. These investments are classified as Other
assets on Citigroup’s Consolidated Balance Sheet.
Changes in the fair values of these investments are classified in Other
revenue in the Company’s Consolidated Statement of Income.
Certain mortgage loans (HFS)
Citigroup has elected the fair value option for certain purchased and
originated prime fixed-rate and conforming adjustable-rate first mortgage
loans HFS. These loans are intended for sale or securitization and are hedged
with derivative instruments. The Company has elected the fair value option
to mitigate accounting mismatches in cases where hedge accounting is
complex and to achieve operational simplifications.