Citibank 2012 Annual Report Download - page 103
Download and view the complete annual report
Please find page 103 of the 2012 Citibank annual report below. You can navigate through the pages in the report by either clicking on the pages listed below, or by using the keyword search tool below to find specific information within the annual report.-
 1
1 -
2
-
3
-
4
-
5
-
6
-
7
-
8
-
9
-
10
-
11
-
12
-
13
-
14
-
15
-
16
-
17
-
18
-
19
-
20
-
21
-
22
-
23
-
24
-
25
-
26
-
27
-
28
-
29
-
30
-
31
-
32
-
33
-
34
-
35
-
36
-
37
-
38
-
39
-
40
-
41
-
42
-
43
-
44
-
45
-
46
-
47
-
48
-
49
-
50
-
51
-
52
-
53
-
54
-
55
-
56
-
57
-
58
-
59
-
60
-
61
-
62
-
63
-
64
-
65
-
66
-
67
-
68
-
69
-
70
-
71
-
72
-
73
-
74
-
75
-
76
-
77
-
78
-
79
-
80
-
81
-
82
-
83
-
84
-
85
-
86
-
87
-
88
-
89
-
90
-
91
-
92
-
 93
93 -
 94
94 -
 95
95 -
 96
96 -
 97
97 -
 98
98 -
 99
99 -
 100
100 -
 101
101 -
 102
102 -
 103
103 -
 104
104 -
 105
105 -
 106
106 -
 107
107 -
 108
108 -
 109
109 -
 110
110 -
 111
111 -
 112
112 -
 113
113 -
114
-
115
-
116
-
117
-
118
-
119
-
120
-
121
-
122
-
123
-
124
-
125
-
126
-
127
-
128
-
129
-
130
-
131
-
132
-
133
-
134
-
135
-
136
-
137
-
138
-
139
-
140
-
141
-
142
-
143
-
144
-
145
-
146
-
147
-
148
-
149
-
150
-
151
-
152
-
153
-
154
-
155
-
156
-
157
-
158
-
159
-
160
-
161
-
162
-
163
-
164
-
165
-
166
-
167
-
168
-
169
-
170
-
171
-
172
-
173
-
174
-
175
-
176
-
177
-
178
-
179
-
180
-
181
-
182
-
183
-
184
-
185
-
186
-
187
-
188
-
189
-
190
-
191
-
192
-
193
-
194
-
195
-
196
-
197
-
198
-
199
-
200
-
201
-
202
-
203
-
204
-
205
-
206
-
207
-
208
-
209
-
210
-
211
-
212
-
213
-
214
-
215
-
216
-
217
-
218
-
219
-
220
-
221
-
222
-
223
-
224
-
225
-
226
-
227
-
228
-
229
-
230
-
231
-
232
-
233
-
234
-
235
-
236
-
237
-
238
-
239
-
240
-
241
-
242
-
243
-
244
-
245
-
246
-
247
-
248
-
249
-
250
-
251
-
252
-
253
-
254
-
255
-
256
-
257
-
258
-
259
-
260
-
261
-
262
-
263
-
264
-
265
-
266
-
267
-
268
-
269
-
270
-
271
-
272
-
273
-
274
-
275
-
276
-
277
-
278
-
279
-
280
-
281
-
282
-
283
-
284
-
285
-
286
-
287
-
288
-
289
-
290
-
291
-
292
-
293
-
294
-
295
-
296
-
297
-
298
-
299
-
300
-
301
-
302
-
303
-
304
-
305
-
306
-
307
-
308
-
309
-
310
-
311
-
312
-
313
-
314
-
315
-
316
-
317
-
318
-
319
-
320
-
321
-
322
-
323
-
324
 |
 |

81
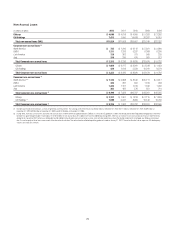
Renegotiated Loans
The following table presents Citi’s loans modified in TDRs.
In millions of dollars
Dec. 31,
2012
Dec. 31,
2011
Corporate renegotiated loans (1)
In U.S. offices
Commercial and industrial (2) $ 180 $ 206
Mortgage and real estate (3) 72 241
Loans to financial institutions 17 85
Other 447 546
$ 716 $ 1,078
In offices outside the U.S.
Commercial and industrial (2) $ 95 $ 223
Mortgage and real estate (3) 59 17
Loans to financial institutions —12
Other 36
$ 157 $ 258
Total Corporate renegotiated loans $ 873 $ 1,336
Consumer renegotiated loans (4)(5)(6)(7)
In U.S. offices
Mortgage and real estate (8) $22,903 $21,429
Cards 3,718 5,766
Installment and other 1,088 1,357
$27,709 $28,552
In offices outside the U.S.
Mortgage and real estate $ 932 $ 936
Cards 866 929
Installment and other 904 1,342
$ 2,702 $ 3,207
Total Consumer renegotiated loans $30,411 $31,759
(1) Includes $267 million and $455 million of non-accrual loans included in the non-accrual assets table
above at December 31, 2012 and December 31, 2011, respectively. The remaining loans are accruing
interest.
(2) In addition to modifications reflected as TDRs at December 31, 2012, Citi also modified $1 million
and $293 million of commercial loans risk rated “Substandard Non-Performing” or worse (asset
category defined by banking regulators) in U.S. offices and offices outside the U.S., respectively. These
modifications were not considered TDRs because the modifications did not involve a concession (a
required element of a TDR for accounting purposes).
(3) In addition to modifications reflected as TDRs at December 31, 2012, Citi also modified $7 million
of commercial real estate loans risk rated “Substandard Non-Performing” or worse (asset category
defined by banking regulators) in U.S. offices. These modifications were not considered TDRs because
the modifications did not involve a concession (a required element of a TDR for accounting purposes).
4) Includes $4,198 million and $2,269 million of non-accrual loans included in the non-accrual assets
table above at December 31, 2012 and December 31, 2011, respectively. The remaining loans are
accruing interest.
(5) Includes $38 million and $19 million of commercial real estate loans at December 31, 2012 and
December 31, 2011, respectively.
(6) Includes $261 million and $257 million of commercial loans at December 31, 2012 and
December 31, 2011, respectively.
(7) Smaller-balance homogeneous loans were derived from Citi’s risk management systems.
(8) Includes an increase of $1,714 million of TDRs in the third quarter of 2012 as a result of OCC
guidance regarding mortgage loans where the borrower has gone through Chapter 7 bankruptcy. See
footnote 2 to the “Non-Accrual Loans” table above.
In certain circumstances, Citigroup modifies certain of its Corporate
loans involving a non-troubled borrower. These modifications are subject
to Citi’s normal underwriting standards for new loans and are made in the
normal course of business to match customers’ needs with available Citi
products or programs (these modifications are not included in the table
above). In other cases, loan modifications involve a troubled borrower to
whom Citi may grant a concession (modification). Modifications involving
troubled borrowers may include extension of maturity date, reduction
in the stated interest rate, rescheduling of future cash flows, principal
reductions or reduction or waiver of accrued interest or fees. See Note 16 to
the Consolidated Financial Statements for a discussion of such modifications.
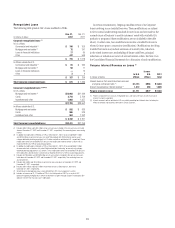
Forgone Interest Revenue on Loans (1)
In millions of dollars
In U.S.
offices
In non-
U.S.
offices
2012
total
Interest revenue that would have been accrued
at original contractual rates (2) $ 3,123 $965 $4,088
Amount recognized as interest revenue (2) 1,412 388 1,800
Forgone interest revenue $1,711 $577 $ 2,288
(1) Relates to Corporate non-accruals, renegotiated loans and Consumer loans on which accrual of
interest has been suspended.
(2) Interest revenue in offices outside the U.S. may reflect prevailing local interest rates, including the
effects of inflation and monetary correction in certain countries.