Citibank 2012 Annual Report Download - page 270
Download and view the complete annual report
Please find page 270 of the 2012 Citibank annual report below. You can navigate through the pages in the report by either clicking on the pages listed below, or by using the keyword search tool below to find specific information within the annual report.-
 1
1 -
2
-
3
-
4
-
5
-
6
-
7
-
8
-
9
-
10
-
11
-
12
-
13
-
14
-
15
-
16
-
17
-
18
-
19
-
20
-
21
-
22
-
23
-
24
-
25
-
26
-
27
-
28
-
29
-
30
-
31
-
32
-
33
-
34
-
35
-
36
-
37
-
38
-
39
-
40
-
41
-
42
-
43
-
44
-
45
-
46
-
47
-
48
-
49
-
50
-
51
-
52
-
53
-
54
-
55
-
56
-
57
-
58
-
59
-
60
-
61
-
62
-
63
-
64
-
65
-
66
-
67
-
68
-
69
-
70
-
71
-
72
-
73
-
74
-
75
-
76
-
77
-
78
-
79
-
80
-
81
-
82
-
83
-
84
-
85
-
86
-
87
-
88
-
89
-
90
-
91
-
92
-
93
-
94
-
95
-
96
-
97
-
98
-
99
-
100
-
101
-
102
-
103
-
104
-
105
-
106
-
107
-
108
-
109
-
110
-
111
-
112
-
113
-
114
-
115
-
116
-
117
-
118
-
119
-
120
-
121
-
122
-
123
-
124
-
125
-
126
-
127
-
128
-
129
-
130
-
131
-
132
-
133
-
134
-
135
-
136
-
137
-
138
-
139
-
140
-
141
-
142
-
143
-
144
-
145
-
146
-
147
-
148
-
149
-
150
-
151
-
152
-
153
-
154
-
155
-
156
-
157
-
158
-
159
-
160
-
161
-
162
-
163
-
164
-
165
-
166
-
167
-
168
-
169
-
170
-
171
-
172
-
173
-
174
-
175
-
176
-
177
-
178
-
179
-
180
-
181
-
182
-
183
-
184
-
185
-
186
-
187
-
188
-
189
-
190
-
191
-
192
-
193
-
194
-
195
-
196
-
197
-
198
-
199
-
200
-
201
-
202
-
203
-
204
-
205
-
206
-
207
-
208
-
209
-
210
-
211
-
212
-
213
-
214
-
215
-
216
-
217
-
218
-
219
-
220
-
221
-
222
-
223
-
224
-
225
-
226
-
227
-
228
-
229
-
230
-
231
-
232
-
233
-
234
-
235
-
236
-
237
-
238
-
239
-
240
-
241
-
242
-
243
-
244
-
245
-
246
-
247
-
248
-
249
-
250
-
251
-
252
-
253
-
254
-
255
-
256
-
257
-
258
-
259
-
 260
260 -
 261
261 -
 262
262 -
 263
263 -
 264
264 -
 265
265 -
 266
266 -
 267
267 -
 268
268 -
 269
269 -
 270
270 -
 271
271 -
 272
272 -
 273
273 -
 274
274 -
 275
275 -
 276
276 -
 277
277 -
 278
278 -
 279
279 -
 280
280 -
281
-
282
-
283
-
284
-
285
-
286
-
287
-
288
-
289
-
290
-
291
-
292
-
293
-
294
-
295
-
296
-
297
-
298
-
299
-
300
-
301
-
302
-
303
-
304
-
305
-
306
-
307
-
308
-
309
-
310
-
311
-
312
-
313
-
314
-
315
-
316
-
317
-
318
-
319
-
320
-
321
-
322
-
323
-
324
 |
 |

248
The range of credit derivatives sold includes credit default swaps, total
return swaps, credit options and credit-linked notes.
A credit default swap is a contract in which, for a fee, a protection seller
agrees to reimburse a protection buyer for any losses that occur due to
a credit event on a reference entity. If there is no credit default event or
settlement trigger, as defined by the specific derivative contract, then the
protection seller makes no payments to the protection buyer and receives only
the contractually specified fee. However, if a credit event occurs as defined in
the specific derivative contract sold, the protection seller will be required to
make a payment to the protection buyer.
A total return swap transfers the total economic performance of a
reference asset, which includes all associated cash flows, as well as capital
appreciation or depreciation. The protection buyer receives a floating rate
of interest and any depreciation on the reference asset from the protection
seller and, in return, the protection seller receives the cash flows associated
with the reference asset plus any appreciation. Thus, according to the total
return swap agreement, the protection seller will be obligated to make a
payment any time the floating interest rate payment and any depreciation
of the reference asset exceed the cash flows associated with the underlying
asset. A total return swap may terminate upon a default of the reference asset
subject to the provisions of the related total return swap agreement between
the protection seller and the protection buyer.
A credit option is a credit derivative that allows investors to trade or hedge
changes in the credit quality of the reference asset. For example, in a credit
spread option, the option writer assumes the obligation to purchase or sell the
reference asset at a specified “strike” spread level. The option purchaser buys
the right to sell the reference asset to, or purchase it from, the option writer at
the strike spread level. The payments on credit spread options depend either
on a particular credit spread or the price of the underlying credit-sensitive
asset. The options usually terminate if the underlying assets default.
A credit-linked note is a form of credit derivative structured as a debt
security with an embedded credit default swap. The purchaser of the note
writes credit protection to the issuer, and receives a return that will be
negatively affected by credit events on the underlying reference credit. If
the reference entity defaults, the purchaser of the credit-linked note may
assume the long position in the debt security and any future cash flows
from it, but will lose the amount paid to the issuer of the credit-linked note.
Thus the maximum amount of the exposure is the carrying amount of the
credit-linked note. As of December 31, 2012 and December 31, 2011, the
amount of credit-linked notes held by the Company in trading inventory
was immaterial.
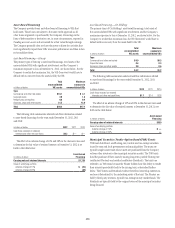
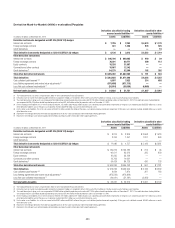
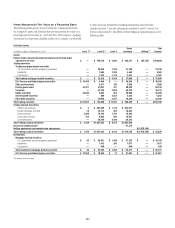
The following tables summarize the key characteristics of the Company’s
credit derivative portfolio as protection seller as of December 31, 2012 and
December 31, 2011:
In millions of dollars as of
December 31, 2012
Maximum potential
amount of
future payments
Fair
value
payable (1)(2)
By industry/counterparty
Bank $ 863,411 $18,824
Broker-dealer 304,968 9,193
Non-financial 3,241 87
Insurance and other financial institutions 174,874 3,726
Total by industry/counterparty $1,346,494 $31,830
By instrument
Credit default swaps and options $1,345,162 $31,624
Total return swaps and other 1,332 206
Total by instrument $1,346,494 $31,830
By rating
Investment grade $ 637,343 $ 6,290
Non-investment grade 200,529 15,591
Not rated 508,622 9,949
Total by rating $1,346,494 $31,830
By maturity
Within 1 year $ 287,670 $ 2,388
From 1 to 5 years 965,059 21,542
After 5 years 93,765 7,900
Total by maturity $1,346,494 $31,830
(1) In addition, fair value amounts payable under credit derivatives purchased were $20,878 million.
(2) In addition, fair value amounts receivable under credit derivatives sold were $19,710 million.
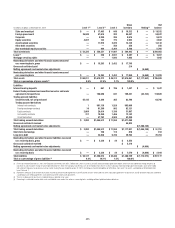
In millions of dollars as of
December 31, 2011
Maximum potential
amount of
future payments
Fair
value
payable (1)(2)
By industry/counterparty
Bank $ 929,608 $45,920
Broker-dealer 321,293 19,026
Non-financial 1,048 98
Insurance and other financial institutions 142,579 7,447
Total by industry/counterparty $1,394,528 $72,491
By instrument
Credit default swaps and options $1,393,082 $72,358
Total return swaps and other 1,446 133
Total by instrument $1,394,528 $72,491
By rating
Investment grade $ 611,447 $16,913
Non-investment grade 226,939 28,034
Not rated 556,142 27,544
Total by rating $1,394,528 $72,491
By maturity
Within 1 year $ 266,723 $ 3,705
From 1 to 5 years 947,211 46,596
After 5 years 180,594 22,190
Total by maturity $1,394,528 $72,491
(1) In addition, fair value amounts payable under credit derivatives purchased were $12,361 million.
(2) In addition, fair value amounts receivable under credit derivatives sold were $11,335 million.