Citibank 2012 Annual Report Download - page 281
Download and view the complete annual report
Please find page 281 of the 2012 Citibank annual report below. You can navigate through the pages in the report by either clicking on the pages listed below, or by using the keyword search tool below to find specific information within the annual report.-
 1
1 -
2
-
3
-
4
-
5
-
6
-
7
-
8
-
9
-
10
-
11
-
12
-
13
-
14
-
15
-
16
-
17
-
18
-
19
-
20
-
21
-
22
-
23
-
24
-
25
-
26
-
27
-
28
-
29
-
30
-
31
-
32
-
33
-
34
-
35
-
36
-
37
-
38
-
39
-
40
-
41
-
42
-
43
-
44
-
45
-
46
-
47
-
48
-
49
-
50
-
51
-
52
-
53
-
54
-
55
-
56
-
57
-
58
-
59
-
60
-
61
-
62
-
63
-
64
-
65
-
66
-
67
-
68
-
69
-
70
-
71
-
72
-
73
-
74
-
75
-
76
-
77
-
78
-
79
-
80
-
81
-
82
-
83
-
84
-
85
-
86
-
87
-
88
-
89
-
90
-
91
-
92
-
93
-
94
-
95
-
96
-
97
-
98
-
99
-
100
-
101
-
102
-
103
-
104
-
105
-
106
-
107
-
108
-
109
-
110
-
111
-
112
-
113
-
114
-
115
-
116
-
117
-
118
-
119
-
120
-
121
-
122
-
123
-
124
-
125
-
126
-
127
-
128
-
129
-
130
-
131
-
132
-
133
-
134
-
135
-
136
-
137
-
138
-
139
-
140
-
141
-
142
-
143
-
144
-
145
-
146
-
147
-
148
-
149
-
150
-
151
-
152
-
153
-
154
-
155
-
156
-
157
-
158
-
159
-
160
-
161
-
162
-
163
-
164
-
165
-
166
-
167
-
168
-
169
-
170
-
171
-
172
-
173
-
174
-
175
-
176
-
177
-
178
-
179
-
180
-
181
-
182
-
183
-
184
-
185
-
186
-
187
-
188
-
189
-
190
-
191
-
192
-
193
-
194
-
195
-
196
-
197
-
198
-
199
-
200
-
201
-
202
-
203
-
204
-
205
-
206
-
207
-
208
-
209
-
210
-
211
-
212
-
213
-
214
-
215
-
216
-
217
-
218
-
219
-
220
-
221
-
222
-
223
-
224
-
225
-
226
-
227
-
228
-
229
-
230
-
231
-
232
-
233
-
234
-
235
-
236
-
237
-
238
-
239
-
240
-
241
-
242
-
243
-
244
-
245
-
246
-
247
-
248
-
249
-
250
-
251
-
252
-
253
-
254
-
255
-
256
-
257
-
258
-
259
-
260
-
261
-
262
-
263
-
264
-
265
-
266
-
267
-
268
-
269
-
270
-
 271
271 -
 272
272 -
 273
273 -
 274
274 -
 275
275 -
 276
276 -
 277
277 -
 278
278 -
 279
279 -
 280
280 -
 281
281 -
 282
282 -
 283
283 -
 284
284 -
 285
285 -
 286
286 -
 287
287 -
 288
288 -
 289
289 -
 290
290 -
 291
291 -
292
-
293
-
294
-
295
-
296
-
297
-
298
-
299
-
300
-
301
-
302
-
303
-
304
-
305
-
306
-
307
-
308
-
309
-
310
-
311
-
312
-
313
-
314
-
315
-
316
-
317
-
318
-
319
-
320
-
321
-
322
-
323
-
324
 |
 |

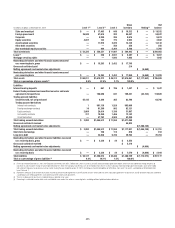
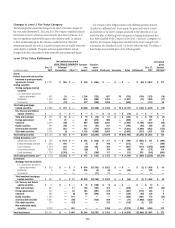
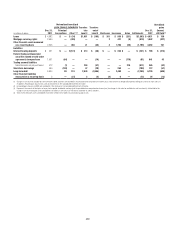
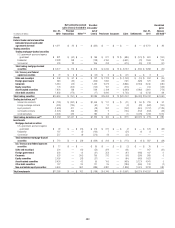
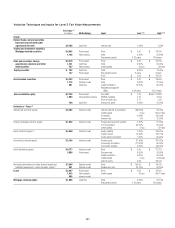
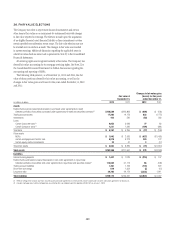
259
Net realized/unrealized
gains (losses) included in Transfers
into
Level 3
Transfers
out of
Level 3 Purchases Issuances Sales Settlements
Dec. 31,
2012
Unrealized
gains
(losses)
still held (3)
In millions of dollars
Dec. 31,
2011
Principal
transactions Other (1)(2)
Loans $4,682 $ — $ (34) $1,051 $ (185) $ 301 $ 930 $ (251) $(1,563) $ 4,931 $ 156
Mortgage servicing rights 2,569 — (426) — — 2 421 (5) (619) 1,942 (427)
Other financial assets measured
on a recurring basis 2,245 — 366 21 (35) 4 1,700 (50) (1,799) 2,452 101
Liabilities
Interest-bearing deposits $ 431 $ — $(141) $ 213 $ (36) $ — $ 268 $ — $ (231) $ 786 $ (414)
Federal funds purchased and
securities loaned or sold under
agreements to repurchase 1,061 (64) — — (14) — — (179) (91) 841 43
Trading account liabilities
Securities sold, not yet purchased 412 (1) — 294 (47) — — 216 (511) 365 (42)
Short-term borrowings 499 (108) — 47 (20) — 268 — (790) 112 (57)
Long-term debt 6,904 98 119 2,548 (2,694) — 2,480 — (2,295) 6,726 (688)
Other financial liabilities
measured on a recurring basis 3— (31) 2 (2) (4) 6 — (12) 24 (13)
(1) Changes in fair value for available-for-sale investments (debt securities) are recorded in Accumulated other comprehensive income (loss), unless other-than-temporarily impaired, while gains and losses from sales are
recorded in Realized gains (losses) from sales of investments on the Consolidated Statement of Income.
(2) Unrealized gains (losses) on MSRs are recorded in Other revenue on the Consolidated Statement of Income.
(3) Represents the amount of total gains or losses for the period, included in earnings (and Accumulated other comprehensive income (loss) for changes in fair value for available-for-sale investments), attributable to the
change in fair value relating to assets and liabilities classified as Level 3 that are still held at December 31, 2012 and 2011.
(4) Total Level 3 derivative assets and liabilities have been netted in these tables for presentation purposes only.