Citibank 2012 Annual Report Download - page 212
Download and view the complete annual report
Please find page 212 of the 2012 Citibank annual report below. You can navigate through the pages in the report by either clicking on the pages listed below, or by using the keyword search tool below to find specific information within the annual report.-
 1
1 -
2
-
3
-
4
-
5
-
6
-
7
-
8
-
9
-
10
-
11
-
12
-
13
-
14
-
15
-
16
-
17
-
18
-
19
-
20
-
21
-
22
-
23
-
24
-
25
-
26
-
27
-
28
-
29
-
30
-
31
-
32
-
33
-
34
-
35
-
36
-
37
-
38
-
39
-
40
-
41
-
42
-
43
-
44
-
45
-
46
-
47
-
48
-
49
-
50
-
51
-
52
-
53
-
54
-
55
-
56
-
57
-
58
-
59
-
60
-
61
-
62
-
63
-
64
-
65
-
66
-
67
-
68
-
69
-
70
-
71
-
72
-
73
-
74
-
75
-
76
-
77
-
78
-
79
-
80
-
81
-
82
-
83
-
84
-
85
-
86
-
87
-
88
-
89
-
90
-
91
-
92
-
93
-
94
-
95
-
96
-
97
-
98
-
99
-
100
-
101
-
102
-
103
-
104
-
105
-
106
-
107
-
108
-
109
-
110
-
111
-
112
-
113
-
114
-
115
-
116
-
117
-
118
-
119
-
120
-
121
-
122
-
123
-
124
-
125
-
126
-
127
-
128
-
129
-
130
-
131
-
132
-
133
-
134
-
135
-
136
-
137
-
138
-
139
-
140
-
141
-
142
-
143
-
144
-
145
-
146
-
147
-
148
-
149
-
150
-
151
-
152
-
153
-
154
-
155
-
156
-
157
-
158
-
159
-
160
-
161
-
162
-
163
-
164
-
165
-
166
-
167
-
168
-
169
-
170
-
171
-
172
-
173
-
174
-
175
-
176
-
177
-
178
-
179
-
180
-
181
-
182
-
183
-
184
-
185
-
186
-
187
-
188
-
189
-
190
-
191
-
192
-
193
-
194
-
195
-
196
-
197
-
198
-
199
-
200
-
201
-
 202
202 -
 203
203 -
 204
204 -
 205
205 -
 206
206 -
 207
207 -
 208
208 -
 209
209 -
 210
210 -
 211
211 -
 212
212 -
 213
213 -
 214
214 -
 215
215 -
 216
216 -
 217
217 -
 218
218 -
 219
219 -
 220
220 -
 221
221 -
 222
222 -
223
-
224
-
225
-
226
-
227
-
228
-
229
-
230
-
231
-
232
-
233
-
234
-
235
-
236
-
237
-
238
-
239
-
240
-
241
-
242
-
243
-
244
-
245
-
246
-
247
-
248
-
249
-
250
-
251
-
252
-
253
-
254
-
255
-
256
-
257
-
258
-
259
-
260
-
261
-
262
-
263
-
264
-
265
-
266
-
267
-
268
-
269
-
270
-
271
-
272
-
273
-
274
-
275
-
276
-
277
-
278
-
279
-
280
-
281
-
282
-
283
-
284
-
285
-
286
-
287
-
288
-
289
-
290
-
291
-
292
-
293
-
294
-
295
-
296
-
297
-
298
-
299
-
300
-
301
-
302
-
303
-
304
-
305
-
306
-
307
-
308
-
309
-
310
-
311
-
312
-
313
-
314
-
315
-
316
-
317
-
318
-
319
-
320
-
321
-
322
-
323
-
324
 |
 |

190
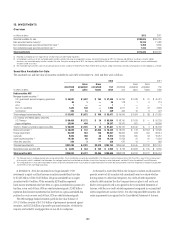
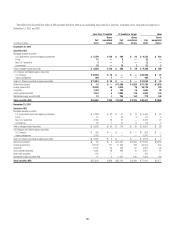
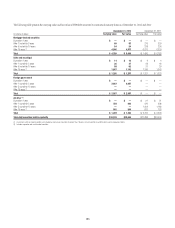
15. INVESTMENTS
Overview
In millions of dollars 2012 2011
Securities available-for-sale $288,695 $265,204
Debt securities held-to-maturity (1) 10,130 11,483
Non-marketable equity securities carried at fair value (2) 5,768 8,836
Non-marketable equity securities carried at cost (3) 7,733 7,890
Total investments $312,326 $293,413
(1) Recorded at amortized cost less impairment for securities that have credit-related impairment.
(2) Unrealized gains and losses for non-marketable equity securities carried at fair value are recognized in earnings. During the third quarter of 2012, the Company sold EMI Music resulting in a total $1.5 billion
decrease in non-marketable equity securities carried at fair value. During the second quarter of 2012, the Company sold EMI Music Publishing resulting in a total of $1.3 billion decrease in non-marketable equity
securities carried at fair value.
(3) Non-marketable equity securities carried at cost primarily consist of shares issued by the Federal Reserve Bank, Federal Home Loan Banks, foreign central banks and various clearing houses of which Citigroup is a member.
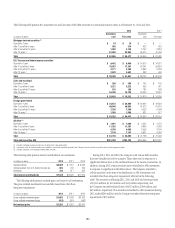
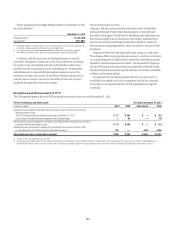
Securities Available-for-Sale
The amortized cost and fair value of securities available-for-sale (AFS) at December 31, 2012 and 2011 were as follows:
2012 2011
In millions of dollars
Amortized
cost
Gross
unrealized
gains
Gross
unrealized
losses
Fair
value
Amortized
cost
Gross
unrealized
gains
Gross
unrealized
losses
Fair
value
Debt securities AFS
Mortgage-backed securities (1)
U.S. government-sponsored agency guaranteed $ 46,001 $1,507 $ 163 $ 47,345 $ 44,394 $ 1,438 $ 51 $ 45,781
Prime 85 1 — 86 118 1 6 113
Alt-A 1 — — 1 1 — — 1
Non-U.S. residential 7,442 148 — 7,590 4,671 9 22 4,658
Commercial 436 16 3 449 465 16 9 472
Total mortgage-backed securities $ 53,965 $ 1,672 $ 166 $ 55,471 $ 49,649 $ 1,464 $ 88 $ 51,025
U.S. Treasury and federal agency securities
U.S. Treasury $ 64,456 $ 1,172 $ 34 $ 65,594 $ 48,790 $ 1,439 $ — $ 50,229
Agency obligations 25,844 404 1 26,247 34,310 601 2 34,909
Total U.S. Treasury and federal agency securities $ 90,300 $1,576 $ 35 $ 91,841 $ 83,100 $2,040 $ 2 $ 85,138
State and municipal (2) $ 20,020 $ 132 $1,820 $ 18,332 $ 16,819 $ 134 $ 2,554 $ 14,399
Foreign government 93,259 918 130 94,047 84,360 558 404 84,514
Corporate 9,302 398 26 9,674 10,005 305 53 10,257
Asset-backed securities (1) 14,188 85 143 14,130 11,053 31 81 11,003
Other debt securities 256 2 — 258 670 13 — 683
Total debt securities AFS $281,290 $4,783 $2,320 $283,753 $255,656 $ 4,545 $ 3,182 $257,019
Marketable equity securities AFS $ 4,643 $ 444 $ 145 $ 4,942 $ 6,722 $ 1,658 $ 195 $ 8,185
Total securities AFS $285,933 $ 5,227 $2,465 $288,695 $262,378 $ 6,203 $ 3,377 $265,204
(1) The Company invests in mortgage-backed and asset-backed securities. These securitizations are generally considered VIEs. The Company’s maximum exposure to loss from these VIEs is equal to the carrying amount
of the securities, which is reflected in the table above. For mortgage-backed and asset-backed securitizations in which the Company has other involvement, see Note 22 to the Consolidated Financial Statements.
(2) The unrealized losses on state and municipal debt securities are primarily attributable to the result of yields on taxable fixed income instruments decreasing relatively faster than the general tax-exempt municipal yields
and the effects of fair value hedge accounting.
At December 31, 2012, the amortized cost of approximately 3,500
investments in equity and fixed-income securities exceeded their fair value
by $2.465 billion. Of the $2.465 billion, the gross unrealized loss on equity
securities was $145 million. Of the remainder, $238 million represents
fixed-income investments that have been in a gross-unrealized-loss position for
less than a year and, of these, 98% are rated investment grade; $2.082 billion
represents fixed-income investments that have been in a gross-unrealized-loss
position for a year or more and, of these, 92% are rated investment grade.
The AFS mortgage-backed securities portfolio fair value balance of
$55.471 billion consists of $47.345 billion of government-sponsored agency
securities, and $8.126 billion of privately sponsored securities, of which the
majority are backed by mortgages that are not Alt-A or subprime.
As discussed in more detail below, the Company conducts and documents
periodic reviews of all securities with unrealized losses to evaluate whether
the impairment is other than temporary. Any credit-related impairment
related to debt securities that the Company does not plan to sell and is not
likely to be required to sell is recognized in the Consolidated Statement of
Income, with the non-credit-related impairment recognized in accumulated
other comprehensive income (AOCI). For other impaired debt securities, the
entire impairment is recognized in the Consolidated Statement of Income.