Citibank 2012 Annual Report Download - page 39
Download and view the complete annual report
Please find page 39 of the 2012 Citibank annual report below. You can navigate through the pages in the report by either clicking on the pages listed below, or by using the keyword search tool below to find specific information within the annual report.-
 1
1 -
2
-
3
-
4
-
5
-
6
-
7
-
8
-
9
-
10
-
11
-
12
-
13
-
14
-
15
-
16
-
17
-
18
-
19
-
20
-
21
-
22
-
23
-
24
-
25
-
26
-
27
-
28
-
 29
29 -
 30
30 -
 31
31 -
 32
32 -
 33
33 -
 34
34 -
 35
35 -
 36
36 -
 37
37 -
 38
38 -
 39
39 -
 40
40 -
 41
41 -
 42
42 -
 43
43 -
 44
44 -
 45
45 -
 46
46 -
 47
47 -
 48
48 -
 49
49 -
50
-
51
-
52
-
53
-
54
-
55
-
56
-
57
-
58
-
59
-
60
-
61
-
62
-
63
-
64
-
65
-
66
-
67
-
68
-
69
-
70
-
71
-
72
-
73
-
74
-
75
-
76
-
77
-
78
-
79
-
80
-
81
-
82
-
83
-
84
-
85
-
86
-
87
-
88
-
89
-
90
-
91
-
92
-
93
-
94
-
95
-
96
-
97
-
98
-
99
-
100
-
101
-
102
-
103
-
104
-
105
-
106
-
107
-
108
-
109
-
110
-
111
-
112
-
113
-
114
-
115
-
116
-
117
-
118
-
119
-
120
-
121
-
122
-
123
-
124
-
125
-
126
-
127
-
128
-
129
-
130
-
131
-
132
-
133
-
134
-
135
-
136
-
137
-
138
-
139
-
140
-
141
-
142
-
143
-
144
-
145
-
146
-
147
-
148
-
149
-
150
-
151
-
152
-
153
-
154
-
155
-
156
-
157
-
158
-
159
-
160
-
161
-
162
-
163
-
164
-
165
-
166
-
167
-
168
-
169
-
170
-
171
-
172
-
173
-
174
-
175
-
176
-
177
-
178
-
179
-
180
-
181
-
182
-
183
-
184
-
185
-
186
-
187
-
188
-
189
-
190
-
191
-
192
-
193
-
194
-
195
-
196
-
197
-
198
-
199
-
200
-
201
-
202
-
203
-
204
-
205
-
206
-
207
-
208
-
209
-
210
-
211
-
212
-
213
-
214
-
215
-
216
-
217
-
218
-
219
-
220
-
221
-
222
-
223
-
224
-
225
-
226
-
227
-
228
-
229
-
230
-
231
-
232
-
233
-
234
-
235
-
236
-
237
-
238
-
239
-
240
-
241
-
242
-
243
-
244
-
245
-
246
-
247
-
248
-
249
-
250
-
251
-
252
-
253
-
254
-
255
-
256
-
257
-
258
-
259
-
260
-
261
-
262
-
263
-
264
-
265
-
266
-
267
-
268
-
269
-
270
-
271
-
272
-
273
-
274
-
275
-
276
-
277
-
278
-
279
-
280
-
281
-
282
-
283
-
284
-
285
-
286
-
287
-
288
-
289
-
290
-
291
-
292
-
293
-
294
-
295
-
296
-
297
-
298
-
299
-
300
-
301
-
302
-
303
-
304
-
305
-
306
-
307
-
308
-
309
-
310
-
311
-
312
-
313
-
314
-
315
-
316
-
317
-
318
-
319
-
320
-
321
-
322
-
323
-
324
 |
 |

17
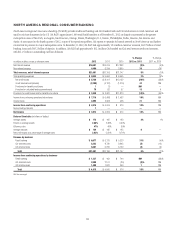
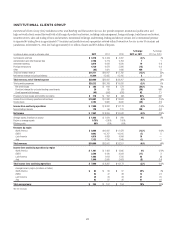
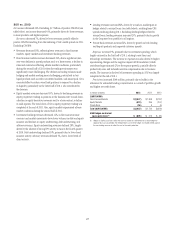
2012 vs. 2011
Net income increased 18%, mainly driven by higher mortgage revenues and
a $2.3 billion decrease in net credit losses, partially offset by a $1.8 billion
reduction in loan loss reserve releases.
Revenues increased 5%, driven by a 38% increase in non-interest revenues
from higher gains on sale of mortgages, partly offset by a 2% decline in
net interest revenues. The higher gains on sale of mortgages were driven
by high volumes of mortgage refinancing activity, due largely to the U.S.
government’s Home Affordable Refinance Program (HARP), as well as
higher margins resulting from the shift to retail as compared to third-party
origination channels. Assuming the continued low interest rate environment,
Citi believes the higher mortgage refinancing volumes could continue into
the first half of 2013. Excluding mortgages, revenue from the retail banking
business was essentially flat, as volume growth and improved mix in the
deposit and lending portfolios was offset by significant spread compression.
Citi expects spread compression to continue to negatively impact revenues
during 2013.
Cards revenues declined 4%. In Citi-branded cards, both average loans
and net interest revenue declined year-over-year, reflecting continued
increased payment rates resulting from consumer deleveraging and the
impact of the look-back provisions of The Credit Card Accountability
Responsibility and Disclosure Act (CARD Act).10 Citi expects the look-back
provisions of the CARD Act will likely have a diminishing impact on the
results of operations of its cards businesses during 2013. In Citi retail
services, net interest revenues improved slightly but were offset by declining
non-interest revenues, driven by improving credit and the resulting impact
on contractual partner payments. Citi expects cards revenues could continue
to be negatively impacted by higher payment rates for consumers, reflecting
ongoing economic uncertainty and deleveraging as well as Citi’s shift to
higher credit quality borrowers.
As part of its U.S. Citi-branded cards business, Citibank, N.A. issues a
co-branded credit card product with American Airlines, the Citi/AAdvantage
card. AMR Corporation and certain of its subsidiaries, including American
Airlines, Inc., filed voluntary petitions for reorganization under Chapter
11 of the U.S. Bankruptcy Code in November 2011. On February 14, 2013,
AMR Corporation and US Airways Group, Inc. announced that the boards of
directors of both companies had approved a merger agreement under which
the companies would be combined. For additional information, see “Risk
Factors—Business and Operational Risks” below.
Expenses increased 3%, primarily due to increased mortgage origination
costs resulting from the higher retail channel mortgage volumes and $100
million of repositioning charges in the fourth quarter of 2012, partially offset
by lower expenses in cards. Expenses continued to be impacted by elevated
legal and related costs.
Provisions decreased 14%, due to lower net credit losses in the cards
portfolio partly offset by continued lower loan loss reserve releases ($2.4
billion in 2012 compared to $4.2 billion in 2011). Assuming no downturn
in the U.S. economic environment, Citi believes credit trends have largely
stabilized in the cards portfolios.
2011 vs. 2010
Net income increased $3.1 billion, driven by higher loan loss reserve releases
and an improvement in net credit losses, partly offset by lower revenues and
higher expenses.
Revenues decreased 7% due to a decrease in net interest and non-interest
revenues. Net interest revenue decreased 5%, driven primarily by lower
cards net interest revenue, which was negatively impacted by the look-back
provision of the CARD Act. In addition, net interest revenue for cards was
negatively impacted by higher promotional balances and lower total average
loans. Non-interest revenue decreased 16%, primarily due to lower gains from
the sale of mortgage loans, as margins declined and Citi held more loans
on-balance sheet, and declining revenues driven by improving credit and the
resulting impact on contractual partner payments in Citi retail services. In
addition, the decline in non-interest revenue reflected lower retail banking
fee income.
Expenses increased 15%, primarily driven by higher investment
spending in the business during the second half of 2011, particularly
in cards marketing and technology, and increases in litigation accruals
related to the interchange fees litigation (see Note 28 to the Consolidated
Financial Statements).
Provisions decreased 66%, primarily due to a loan loss reserve release of
$4.2 billion in 2011, compared to a loan loss reserve release of $1.3 billion in
2010, and lower net credit losses in the cards portfolios (cards net credit losses
declined $5.0 billion, or 38%, from 2010).
10 The CARD Act requires a review once every six months for card accounts where the annual
percentage rate (APR) has been increased since January 1, 2009 to assess whether changes in credit
risk, market conditions or other factors merit a future decline in the APR.