Citibank 2012 Annual Report Download - page 266
Download and view the complete annual report
Please find page 266 of the 2012 Citibank annual report below. You can navigate through the pages in the report by either clicking on the pages listed below, or by using the keyword search tool below to find specific information within the annual report.-
 1
1 -
2
-
3
-
4
-
5
-
6
-
7
-
8
-
9
-
10
-
11
-
12
-
13
-
14
-
15
-
16
-
17
-
18
-
19
-
20
-
21
-
22
-
23
-
24
-
25
-
26
-
27
-
28
-
29
-
30
-
31
-
32
-
33
-
34
-
35
-
36
-
37
-
38
-
39
-
40
-
41
-
42
-
43
-
44
-
45
-
46
-
47
-
48
-
49
-
50
-
51
-
52
-
53
-
54
-
55
-
56
-
57
-
58
-
59
-
60
-
61
-
62
-
63
-
64
-
65
-
66
-
67
-
68
-
69
-
70
-
71
-
72
-
73
-
74
-
75
-
76
-
77
-
78
-
79
-
80
-
81
-
82
-
83
-
84
-
85
-
86
-
87
-
88
-
89
-
90
-
91
-
92
-
93
-
94
-
95
-
96
-
97
-
98
-
99
-
100
-
101
-
102
-
103
-
104
-
105
-
106
-
107
-
108
-
109
-
110
-
111
-
112
-
113
-
114
-
115
-
116
-
117
-
118
-
119
-
120
-
121
-
122
-
123
-
124
-
125
-
126
-
127
-
128
-
129
-
130
-
131
-
132
-
133
-
134
-
135
-
136
-
137
-
138
-
139
-
140
-
141
-
142
-
143
-
144
-
145
-
146
-
147
-
148
-
149
-
150
-
151
-
152
-
153
-
154
-
155
-
156
-
157
-
158
-
159
-
160
-
161
-
162
-
163
-
164
-
165
-
166
-
167
-
168
-
169
-
170
-
171
-
172
-
173
-
174
-
175
-
176
-
177
-
178
-
179
-
180
-
181
-
182
-
183
-
184
-
185
-
186
-
187
-
188
-
189
-
190
-
191
-
192
-
193
-
194
-
195
-
196
-
197
-
198
-
199
-
200
-
201
-
202
-
203
-
204
-
205
-
206
-
207
-
208
-
209
-
210
-
211
-
212
-
213
-
214
-
215
-
216
-
217
-
218
-
219
-
220
-
221
-
222
-
223
-
224
-
225
-
226
-
227
-
228
-
229
-
230
-
231
-
232
-
233
-
234
-
235
-
236
-
237
-
238
-
239
-
240
-
241
-
242
-
243
-
244
-
245
-
246
-
247
-
248
-
249
-
250
-
251
-
252
-
253
-
254
-
255
-
 256
256 -
 257
257 -
 258
258 -
 259
259 -
 260
260 -
 261
261 -
 262
262 -
 263
263 -
 264
264 -
 265
265 -
 266
266 -
 267
267 -
 268
268 -
 269
269 -
 270
270 -
 271
271 -
 272
272 -
 273
273 -
 274
274 -
 275
275 -
 276
276 -
277
-
278
-
279
-
280
-
281
-
282
-
283
-
284
-
285
-
286
-
287
-
288
-
289
-
290
-
291
-
292
-
293
-
294
-
295
-
296
-
297
-
298
-
299
-
300
-
301
-
302
-
303
-
304
-
305
-
306
-
307
-
308
-
309
-
310
-
311
-
312
-
313
-
314
-
315
-
316
-
317
-
318
-
319
-
320
-
321
-
322
-
323
-
324
 |
 |

244
All derivatives are reported on the Consolidated Balance Sheet at fair
value. In addition, where applicable, all such contracts covered by master
netting agreements are reported net. Gross positive fair values are netted with
gross negative fair values by counterparty pursuant to a valid master netting
agreement. In addition, payables and receivables in respect of cash collateral
received from or paid to a given counterparty are included in this netting.
However, non-cash collateral is not included.
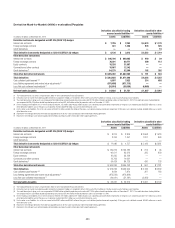
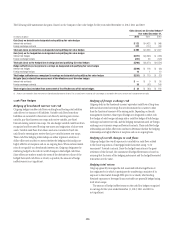
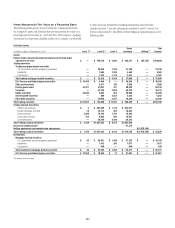
The amounts recognized in Principal transactions in the Consolidated
Statement of Income for the years ended December 31, 2012, 2011 and 2010
related to derivatives not designated in a qualifying hedging relationship as
well as the underlying non-derivative instruments are included in the table
below. Citigroup presents this disclosure by business classification, showing
derivative gains and losses related to its trading activities together with gains
and losses related to non-derivative instruments within the same trading
portfolios, as this represents the way these portfolios are risk managed.
Year ended December 31,
In millions of dollars 2012 2011 2010
Interest rate contracts $2,301 $5,136 $3,231
Foreign exchange 2,403 2,309 1,852
Equity contracts 158 3 995
Commodity and other 92 76 126
Credit derivatives (173) (290) 1,313
Total Citigroup (1) $4,781 $7,234 $7,517
(1) Also see Note 7 to the Consolidated Financial Statements.
The amounts recognized in Other revenue in the Consolidated Statement
of Income for the years ended December 31, 2012, 2011 and 2010 are shown
below. The table below does not include the offsetting gains/losses on the
hedged items, which amounts are also recorded in Other revenue.
Gains (losses) included in Other revenue
Year ended December 31,
In millions of dollars 2012 2011 2010
Interest rate contracts $ (427) $ 1,192 $ (205)
Foreign exchange contracts 182 224 (2,052)
Credit derivatives (1,022) 115 (502)
Total Citigroup (1) $(1,267) $ 1,531 $ (2,759)
(1) Non-designated derivatives are derivative instruments not designated in qualifying hedging relationships.
a ccounting for Derivative Hedging
Citigroup accounts for its hedging activities in accordance with ASC 815,
Derivatives and Hedging (formerly SFAS 133). As a general rule, hedge
accounting is permitted where the Company is exposed to a particular risk,
such as interest-rate or foreign-exchange risk, that causes changes in the fair
value of an asset or liability or variability in the expected future cash flows of an
existing asset, liability or a forecasted transaction that may affect earnings.
Derivative contracts hedging the risks associated with the changes in fair
value are referred to as fair value hedges, while contracts hedging the risks
affecting the expected future cash flows are called cash flow hedges. Hedges
that utilize derivatives or debt instruments to manage the foreign exchange
risk associated with equity investments in non-U.S.-dollar-functional-
currency foreign subsidiaries (net investment in a foreign operation) are
called net investment hedges.
If certain hedging criteria specified in ASC 815 are met, including testing
for hedge effectiveness, special hedge accounting may be applied. The hedge
effectiveness assessment methodologies for similar hedges are performed
in a similar manner and are used consistently throughout the hedging
relationships. For fair value hedges, the changes in value of the hedging
derivative, as well as the changes in value of the related hedged item due to
the risk being hedged, are reflected in current earnings. For cash flow hedges
and net investment hedges, the changes in value of the hedging derivative are
reflected in Accumulated other comprehensive income (loss) in Citigroup’s
stockholders’ equity, to the extent the hedge is effective. Hedge ineffectiveness,
in either case, is reflected in current earnings.