Citibank 2012 Annual Report Download - page 48
Download and view the complete annual report
Please find page 48 of the 2012 Citibank annual report below. You can navigate through the pages in the report by either clicking on the pages listed below, or by using the keyword search tool below to find specific information within the annual report.-
 1
1 -
2
-
3
-
4
-
5
-
6
-
7
-
8
-
9
-
10
-
11
-
12
-
13
-
14
-
15
-
16
-
17
-
18
-
19
-
20
-
21
-
22
-
23
-
24
-
25
-
26
-
27
-
28
-
29
-
30
-
31
-
32
-
33
-
34
-
35
-
36
-
37
-
 38
38 -
 39
39 -
 40
40 -
 41
41 -
 42
42 -
 43
43 -
 44
44 -
 45
45 -
 46
46 -
 47
47 -
 48
48 -
 49
49 -
 50
50 -
 51
51 -
 52
52 -
 53
53 -
 54
54 -
 55
55 -
 56
56 -
 57
57 -
 58
58 -
59
-
60
-
61
-
62
-
63
-
64
-
65
-
66
-
67
-
68
-
69
-
70
-
71
-
72
-
73
-
74
-
75
-
76
-
77
-
78
-
79
-
80
-
81
-
82
-
83
-
84
-
85
-
86
-
87
-
88
-
89
-
90
-
91
-
92
-
93
-
94
-
95
-
96
-
97
-
98
-
99
-
100
-
101
-
102
-
103
-
104
-
105
-
106
-
107
-
108
-
109
-
110
-
111
-
112
-
113
-
114
-
115
-
116
-
117
-
118
-
119
-
120
-
121
-
122
-
123
-
124
-
125
-
126
-
127
-
128
-
129
-
130
-
131
-
132
-
133
-
134
-
135
-
136
-
137
-
138
-
139
-
140
-
141
-
142
-
143
-
144
-
145
-
146
-
147
-
148
-
149
-
150
-
151
-
152
-
153
-
154
-
155
-
156
-
157
-
158
-
159
-
160
-
161
-
162
-
163
-
164
-
165
-
166
-
167
-
168
-
169
-
170
-
171
-
172
-
173
-
174
-
175
-
176
-
177
-
178
-
179
-
180
-
181
-
182
-
183
-
184
-
185
-
186
-
187
-
188
-
189
-
190
-
191
-
192
-
193
-
194
-
195
-
196
-
197
-
198
-
199
-
200
-
201
-
202
-
203
-
204
-
205
-
206
-
207
-
208
-
209
-
210
-
211
-
212
-
213
-
214
-
215
-
216
-
217
-
218
-
219
-
220
-
221
-
222
-
223
-
224
-
225
-
226
-
227
-
228
-
229
-
230
-
231
-
232
-
233
-
234
-
235
-
236
-
237
-
238
-
239
-
240
-
241
-
242
-
243
-
244
-
245
-
246
-
247
-
248
-
249
-
250
-
251
-
252
-
253
-
254
-
255
-
256
-
257
-
258
-
259
-
260
-
261
-
262
-
263
-
264
-
265
-
266
-
267
-
268
-
269
-
270
-
271
-
272
-
273
-
274
-
275
-
276
-
277
-
278
-
279
-
280
-
281
-
282
-
283
-
284
-
285
-
286
-
287
-
288
-
289
-
290
-
291
-
292
-
293
-
294
-
295
-
296
-
297
-
298
-
299
-
300
-
301
-
302
-
303
-
304
-
305
-
306
-
307
-
308
-
309
-
310
-
311
-
312
-
313
-
314
-
315
-
316
-
317
-
318
-
319
-
320
-
321
-
322
-
323
-
324
 |
 |
26
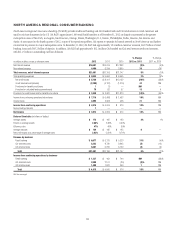
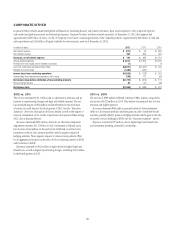
2012 vs. 2011
Net income decreased 10%. Excluding $2.5 billion of negative CVA/DVA (see
table below), net income increased 56%, primarily driven by a 13% increase
in revenues.
Revenues decreased 8%, driven by the negative CVA/DVA and mark-to-
market losses on hedges related to accrual loans. Excluding CVA/DVA:
• Revenues increased 13%, reflecting higher revenues in most major
S&B businesses. Overall, Citi gained wallet share during 2012 in most
major products and regions, while maintaining what it believes to be a
disciplined risk appetite for the market environment.
• Fixed income markets revenues increased 28%, reflecting strong
performance in rates and currencies and higher revenues in credit-related
and securitized products. These results reflected an improved market
environment and more balanced trading flows, particularly in the
second half of 2012. Rates and currencies performance reflected strong
client and trading results in G-10 FX, G-10 rates and Citi’s local markets
franchise. Credit products, securitized markets and municipals products
experienced improved trading results, particularly in the second half of
2012, compared to the prior-year period. Citi’s position serving corporate
clients for markets products also contributed to the strength and diversity
of client flows.
• Equity markets revenues increased 1%, due to improved derivatives
performance as well as the absence of proprietary trading losses in
2011, partially offset by lower cash equity volumes that impacted the
industry as a whole. Citi’s improved performance in derivatives reflected
improved trading and continued progress in capturing additional client
wallet share.
• Investment banking revenues increased 10%, reflecting increases in
debt underwriting and advisory revenues, partially offset by lower equity
underwriting revenues. Debt underwriting revenues rose 18%, driven by
increases in investment grade and high yield bond issuances. Advisory
revenues increased 4%, despite the overall reduction in market activity
during the year. Equity underwriting revenues declined 7%, driven by
lower levels of market and client activity.
• Lending revenues decreased 45%, driven by the mark-to-market losses
on hedges related to accrual loans (see table below). The loss on lending
hedges compared to a gain in the prior year, resulted from CDS spreads
narrowing during 2012. Excluding lending hedges related to accrual
loans, lending revenues increased 31%, primarily driven by growth in the
Corporate loan portfolio and improved spreads in most regions.
• Private Bank revenues increased 8%, driven by growth in client assets as a
result of client acquisition and development efforts in Citi’s targeted client
segments. Deposit volumes, investment assets under management and
loans all increased, while pricing and product mix optimization initiatives
offset underlying spread compression across products.
Expenses decreased 4%. Excluding repositioning charges of $349 million
in 2012 (including $237 million in the fourth quarter of 2012) compared
to $267 million in 2011, expenses also decreased 4%, driven by efficiency
savings from ongoing re-engineering programs and lower compensation
costs. The repositioning efforts in S&B announced in the fourth quarter of
2012 are designed to streamline S&B’s client coverage model and improve
overall productivity.
Provisions increased 5% to $122 million, primarily reflecting lower loan
loss reserve releases, partially offset by lower net credit losses, both due to
portfolio stabilization.