Citibank 2012 Annual Report Download - page 123
Download and view the complete annual report
Please find page 123 of the 2012 Citibank annual report below. You can navigate through the pages in the report by either clicking on the pages listed below, or by using the keyword search tool below to find specific information within the annual report.-
 1
1 -
2
-
3
-
4
-
5
-
6
-
7
-
8
-
9
-
10
-
11
-
12
-
13
-
14
-
15
-
16
-
17
-
18
-
19
-
20
-
21
-
22
-
23
-
24
-
25
-
26
-
27
-
28
-
29
-
30
-
31
-
32
-
33
-
34
-
35
-
36
-
37
-
38
-
39
-
40
-
41
-
42
-
43
-
44
-
45
-
46
-
47
-
48
-
49
-
50
-
51
-
52
-
53
-
54
-
55
-
56
-
57
-
58
-
59
-
60
-
61
-
62
-
63
-
64
-
65
-
66
-
67
-
68
-
69
-
70
-
71
-
72
-
73
-
74
-
75
-
76
-
77
-
78
-
79
-
80
-
81
-
82
-
83
-
84
-
85
-
86
-
87
-
88
-
89
-
90
-
91
-
92
-
93
-
94
-
95
-
96
-
97
-
98
-
99
-
100
-
101
-
102
-
103
-
104
-
105
-
106
-
107
-
108
-
109
-
110
-
111
-
112
-
 113
113 -
 114
114 -
 115
115 -
 116
116 -
 117
117 -
 118
118 -
 119
119 -
 120
120 -
 121
121 -
 122
122 -
 123
123 -
 124
124 -
 125
125 -
 126
126 -
 127
127 -
 128
128 -
 129
129 -
 130
130 -
 131
131 -
 132
132 -
 133
133 -
134
-
135
-
136
-
137
-
138
-
139
-
140
-
141
-
142
-
143
-
144
-
145
-
146
-
147
-
148
-
149
-
150
-
151
-
152
-
153
-
154
-
155
-
156
-
157
-
158
-
159
-
160
-
161
-
162
-
163
-
164
-
165
-
166
-
167
-
168
-
169
-
170
-
171
-
172
-
173
-
174
-
175
-
176
-
177
-
178
-
179
-
180
-
181
-
182
-
183
-
184
-
185
-
186
-
187
-
188
-
189
-
190
-
191
-
192
-
193
-
194
-
195
-
196
-
197
-
198
-
199
-
200
-
201
-
202
-
203
-
204
-
205
-
206
-
207
-
208
-
209
-
210
-
211
-
212
-
213
-
214
-
215
-
216
-
217
-
218
-
219
-
220
-
221
-
222
-
223
-
224
-
225
-
226
-
227
-
228
-
229
-
230
-
231
-
232
-
233
-
234
-
235
-
236
-
237
-
238
-
239
-
240
-
241
-
242
-
243
-
244
-
245
-
246
-
247
-
248
-
249
-
250
-
251
-
252
-
253
-
254
-
255
-
256
-
257
-
258
-
259
-
260
-
261
-
262
-
263
-
264
-
265
-
266
-
267
-
268
-
269
-
270
-
271
-
272
-
273
-
274
-
275
-
276
-
277
-
278
-
279
-
280
-
281
-
282
-
283
-
284
-
285
-
286
-
287
-
288
-
289
-
290
-
291
-
292
-
293
-
294
-
295
-
296
-
297
-
298
-
299
-
300
-
301
-
302
-
303
-
304
-
305
-
306
-
307
-
308
-
309
-
310
-
311
-
312
-
313
-
314
-
315
-
316
-
317
-
318
-
319
-
320
-
321
-
322
-
323
-
324
 |
 |

101
Citigroup also has incorporated climate risk assessment criteria for certain
obligors, as necessary. Factors evaluated include consideration of climate risk
to an obligor’s business and physical assets and, when relevant, consideration
of cost-effective options to reduce greenhouse gas emissions.
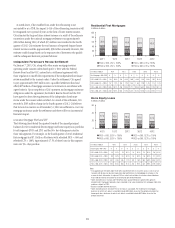
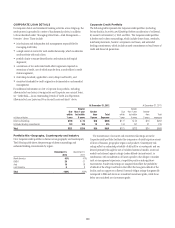
The following table presents the Corporate credit portfolio by facility risk
rating at December 31, 2012 and 2011, as a percentage of the total portfolio:
Direct outstandings and
unfunded lending commitments
December 31,
2012
December 31,
2011
AAA/AA/A 56% 55%
BBB 29 29
BB/B 13 13
CCC or below 22
Unrated —1
Total 100% 100%
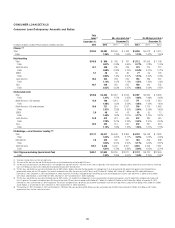
Citi’s Corporate credit portfolio is also diversified by industry, with a
concentration in the financial sector, broadly defined, and including banks,
other financial institutions, insurance companies, investment banks and
government and central banks. The following table shows the allocation of
direct outstandings and unfunded lending commitments to industries as a
percentage of the total Corporate portfolio:
Direct outstandings and
unfunded lending commitments
December 31,
2012
December 31,
2011
Public sector 19% 19%
Transportation and industrial 18 16
Petroleum, energy, chemical and metal 17 17
Banks/broker-dealers 12 13
Consumer retail and health 12 13
Technology, media and telecom 88
Insurance and special purpose entities 55
Real estate 43
Hedge funds 34
Other industries 22
Total 100% 100%
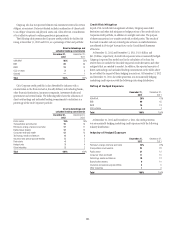
Credit Risk Mitigation
As part of its overall risk management activities, Citigroup uses credit
derivatives and other risk mitigants to hedge portions of the credit risk in its
Corporate credit portfolio, in addition to outright asset sales. The purpose
of these transactions is to transfer credit risk to third parties. The results of
the mark to market and any realized gains or losses on credit derivatives
are reflected in Principal transactions on the Consolidated Statement
of Income.
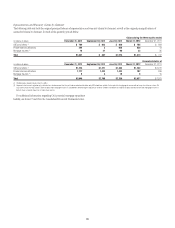
At December 31, 2012 and December 31, 2011, $41.6 billion and
$41.5 billion, respectively, of credit risk exposures were economically hedged.
Citigroup’s expected loss model used in the calculation of its loan loss
reserve does not include the favorable impact of credit derivatives and other
mitigants that are marked to market. In addition, the reported amounts of
direct outstandings and unfunded lending commitments in the tables above
do not reflect the impact of these hedging transactions. At December 31, 2012
and December 31, 2011, the credit protection was economically hedging
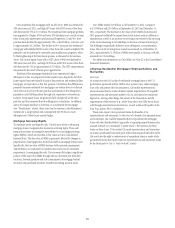
underlying credit exposure with the following risk rating distribution:
Rating of Hedged Exposure
December 31,
2012
December 31,
2011
AAA/AA/A 29% 41%
BBB 49 45
BB/B 19 13
CCC or below 31
Total 100% 100%
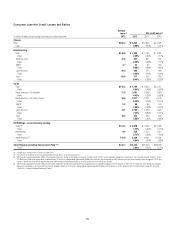
At December 31, 2012 and December 31, 2011, the credit protection
was economically hedging underlying credit exposures with the following
industry distribution:
Industry of Hedged Exposure
December 31,
2012
December 31,
2011
Petroleum, energy, chemical and metal 22% 22%
Transportation and industrial 22 22
Public sector 21 12
Consumer retail and health 11 15
Technology, media and telecom 10 12
Banks/broker-dealers 910
Insurance and special purpose entities 45
Other industries 12
Total 100% 100%