Citibank 2012 Annual Report Download - page 247
Download and view the complete annual report
Please find page 247 of the 2012 Citibank annual report below. You can navigate through the pages in the report by either clicking on the pages listed below, or by using the keyword search tool below to find specific information within the annual report.-
 1
1 -
2
-
3
-
4
-
5
-
6
-
7
-
8
-
9
-
10
-
11
-
12
-
13
-
14
-
15
-
16
-
17
-
18
-
19
-
20
-
21
-
22
-
23
-
24
-
25
-
26
-
27
-
28
-
29
-
30
-
31
-
32
-
33
-
34
-
35
-
36
-
37
-
38
-
39
-
40
-
41
-
42
-
43
-
44
-
45
-
46
-
47
-
48
-
49
-
50
-
51
-
52
-
53
-
54
-
55
-
56
-
57
-
58
-
59
-
60
-
61
-
62
-
63
-
64
-
65
-
66
-
67
-
68
-
69
-
70
-
71
-
72
-
73
-
74
-
75
-
76
-
77
-
78
-
79
-
80
-
81
-
82
-
83
-
84
-
85
-
86
-
87
-
88
-
89
-
90
-
91
-
92
-
93
-
94
-
95
-
96
-
97
-
98
-
99
-
100
-
101
-
102
-
103
-
104
-
105
-
106
-
107
-
108
-
109
-
110
-
111
-
112
-
113
-
114
-
115
-
116
-
117
-
118
-
119
-
120
-
121
-
122
-
123
-
124
-
125
-
126
-
127
-
128
-
129
-
130
-
131
-
132
-
133
-
134
-
135
-
136
-
137
-
138
-
139
-
140
-
141
-
142
-
143
-
144
-
145
-
146
-
147
-
148
-
149
-
150
-
151
-
152
-
153
-
154
-
155
-
156
-
157
-
158
-
159
-
160
-
161
-
162
-
163
-
164
-
165
-
166
-
167
-
168
-
169
-
170
-
171
-
172
-
173
-
174
-
175
-
176
-
177
-
178
-
179
-
180
-
181
-
182
-
183
-
184
-
185
-
186
-
187
-
188
-
189
-
190
-
191
-
192
-
193
-
194
-
195
-
196
-
197
-
198
-
199
-
200
-
201
-
202
-
203
-
204
-
205
-
206
-
207
-
208
-
209
-
210
-
211
-
212
-
213
-
214
-
215
-
216
-
217
-
218
-
219
-
220
-
221
-
222
-
223
-
224
-
225
-
226
-
227
-
228
-
229
-
230
-
231
-
232
-
233
-
234
-
235
-
236
-
 237
237 -
 238
238 -
 239
239 -
 240
240 -
 241
241 -
 242
242 -
 243
243 -
 244
244 -
 245
245 -
 246
246 -
 247
247 -
 248
248 -
 249
249 -
 250
250 -
 251
251 -
 252
252 -
 253
253 -
 254
254 -
 255
255 -
 256
256 -
 257
257 -
258
-
259
-
260
-
261
-
262
-
263
-
264
-
265
-
266
-
267
-
268
-
269
-
270
-
271
-
272
-
273
-
274
-
275
-
276
-
277
-
278
-
279
-
280
-
281
-
282
-
283
-
284
-
285
-
286
-
287
-
288
-
289
-
290
-
291
-
292
-
293
-
294
-
295
-
296
-
297
-
298
-
299
-
300
-
301
-
302
-
303
-
304
-
305
-
306
-
307
-
308
-
309
-
310
-
311
-
312
-
313
-
314
-
315
-
316
-
317
-
318
-
319
-
320
-
321
-
322
-
323
-
324
 |
 |

225
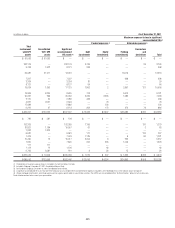
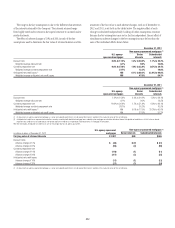
In millions of dollars As of December 31, 2011
Maximum exposure to loss in significant
unconsolidated VIEs (1)
Funded exposures (2) Unfunded exposures (3)
Total
involvement
with SPE
assets
Consolidated
VIE / SPE
assets
Significant
unconsolidated
VIE assets (4)
Debt
investments
Equity
investments
Funding
commitments
Guarantees
and
derivatives Total
$ 87,083 $ 87,083 $ — $ — $ — $ — $ — $ —
232,179 — 232,179 3,769 — — 26 3,795
9,743 1,622 8,121 348 — — — 348
34,987 21,971 13,016 — — 13,016 — 13,016
7,507 — 7,507 — — 298 — 298
3,334 — 3,334 20 — — — 20
8,127 — 8,127 64 — — — 64
19,034 1,303 17,731 7,892 2 2,891 121 10,906
16,849 8,224 8,625 708 — 5,413 — 6,121
20,331 299 20,032 2,345 3,535 1,586 — 7,466
2,110 24 2,086 468 — — — 468
4,621 2,027 2,594 — 70 — — 70
17,882 — 17,882 — 128 — — 128
6,210 97 6,113 354 172 279 79 884
$469,997 $122,650 $347,347 $ 15,968 $ 3,907 $ 23,483 $ 226 $ 43,584
$ 780 $ 581 $ 199 $ — $ — $ — $ — $ —
152,265 — 152,265 1,159 — — 120 1,279
20,821 1,764 19,057 61 — — 2 63
1,822 1,822 — — — — — —
6,581 — 6,581 117 — — 120 237
7,479 — 7,479 1,125 — 6 90 1,221
10,490 73 10,417 5,004 3 250 — 5,257
7,820 — 7,820 206 265 1,049 — 1,520
111 111 — — — — — —
1,114 14 1,100 — 43 — — 43
6,762 6,581 181 3 36 15 — 54
$216,045 $ 10,946 $205,099 $ 7,675 $ 347 $ 1,320 $ 332 $ 9,674
$686,042 $133,596 $552,446 $ 23,643 $ 4,254 $ 24,803 $ 558 $ 53,258
(1) The definition of maximum exposure to loss is included in the text that follows this table.
(2) Included in Citigroup’s December 31, 2011 Consolidated Balance Sheet.
(3) Not included in Citigroup’s December 31, 2011 Consolidated Balance Sheet.
(4) A significant unconsolidated VIE is an entity where the Company has any variable interest considered to be significant, regardless of the likelihood of loss or the notional amount of exposure.
(5) Citicorp mortgage securitizations also include agency and non-agency (private-label) re-securitization activities. These SPEs are not consolidated. See “Re-Securitizations” below for further discussion.
Reclassified to conform to the current year’s presentation.