Citibank 2012 Annual Report Download - page 75
Download and view the complete annual report
Please find page 75 of the 2012 Citibank annual report below. You can navigate through the pages in the report by either clicking on the pages listed below, or by using the keyword search tool below to find specific information within the annual report.-
 1
1 -
2
-
3
-
4
-
5
-
6
-
7
-
8
-
9
-
10
-
11
-
12
-
13
-
14
-
15
-
16
-
17
-
18
-
19
-
20
-
21
-
22
-
23
-
24
-
25
-
26
-
27
-
28
-
29
-
30
-
31
-
32
-
33
-
34
-
35
-
36
-
37
-
38
-
39
-
40
-
41
-
42
-
43
-
44
-
45
-
46
-
47
-
48
-
49
-
50
-
51
-
52
-
53
-
54
-
55
-
56
-
57
-
58
-
59
-
60
-
61
-
62
-
63
-
64
-
 65
65 -
 66
66 -
 67
67 -
 68
68 -
 69
69 -
 70
70 -
 71
71 -
 72
72 -
 73
73 -
 74
74 -
 75
75 -
 76
76 -
 77
77 -
 78
78 -
 79
79 -
 80
80 -
 81
81 -
 82
82 -
 83
83 -
 84
84 -
 85
85 -
86
-
87
-
88
-
89
-
90
-
91
-
92
-
93
-
94
-
95
-
96
-
97
-
98
-
99
-
100
-
101
-
102
-
103
-
104
-
105
-
106
-
107
-
108
-
109
-
110
-
111
-
112
-
113
-
114
-
115
-
116
-
117
-
118
-
119
-
120
-
121
-
122
-
123
-
124
-
125
-
126
-
127
-
128
-
129
-
130
-
131
-
132
-
133
-
134
-
135
-
136
-
137
-
138
-
139
-
140
-
141
-
142
-
143
-
144
-
145
-
146
-
147
-
148
-
149
-
150
-
151
-
152
-
153
-
154
-
155
-
156
-
157
-
158
-
159
-
160
-
161
-
162
-
163
-
164
-
165
-
166
-
167
-
168
-
169
-
170
-
171
-
172
-
173
-
174
-
175
-
176
-
177
-
178
-
179
-
180
-
181
-
182
-
183
-
184
-
185
-
186
-
187
-
188
-
189
-
190
-
191
-
192
-
193
-
194
-
195
-
196
-
197
-
198
-
199
-
200
-
201
-
202
-
203
-
204
-
205
-
206
-
207
-
208
-
209
-
210
-
211
-
212
-
213
-
214
-
215
-
216
-
217
-
218
-
219
-
220
-
221
-
222
-
223
-
224
-
225
-
226
-
227
-
228
-
229
-
230
-
231
-
232
-
233
-
234
-
235
-
236
-
237
-
238
-
239
-
240
-
241
-
242
-
243
-
244
-
245
-
246
-
247
-
248
-
249
-
250
-
251
-
252
-
253
-
254
-
255
-
256
-
257
-
258
-
259
-
260
-
261
-
262
-
263
-
264
-
265
-
266
-
267
-
268
-
269
-
270
-
271
-
272
-
273
-
274
-
275
-
276
-
277
-
278
-
279
-
280
-
281
-
282
-
283
-
284
-
285
-
286
-
287
-
288
-
289
-
290
-
291
-
292
-
293
-
294
-
295
-
296
-
297
-
298
-
299
-
300
-
301
-
302
-
303
-
304
-
305
-
306
-
307
-
308
-
309
-
310
-
311
-
312
-
313
-
314
-
315
-
316
-
317
-
318
-
319
-
320
-
321
-
322
-
323
-
324
 |
 |
53
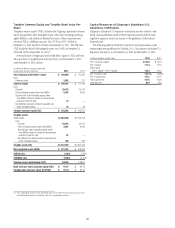
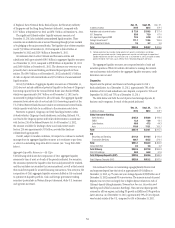
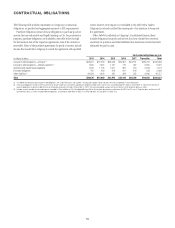
Long-Term Debt Outstanding
The following table sets forth Citi’s total long-term debt outstanding for the
periods indicated:
In billions of dollars
Dec. 31,
2012
Sept. 30,
2012
Dec. 31,
2011
Non-bank $ 188.3 $210.0 $245.6
Senior/subordinated debt (1) 171.0 186.8 216.4
Trust preferred securities 10.1 10.6 16.1
Securitized debt and securitizations (1)(2) 0.4 3.5 4.0
Local country (1) 6.8 9.1 9.1
Bank $ 51.2 $ 61.9 $ 77.9
Senior/subordinated debt 0.1 3.7 10.5
Securitized debt and securitizations (1)(2) 26.0 32.0 46.5
Local country and FHLB borrowings (1)(3) 25.1 26.2 20.9
Total long-term debt $ 239.5 $271.9 $323.5
(1) Includes structured notes in the amount of $27.5 billion and $23.4 billion as of December 31, 2012,
and December 31, 2011, respectively.
(2) Of the approximate $26.4 billion of total bank and non-bank securitized debt and securitizations as
of December 31, 2012, approximately $23.0 billion related to credit card securitizations, the vast
majority of which was at the bank level.
(3) Of this amount, approximately $16.3 billion related to collateralized advances from the FHLB as of
December 31, 2012.
As set forth in the table above, Citi’s overall long-term debt decreased by
approximately $84 billion year-over-year. In the bank, the decrease was due
to securitization and TLGP run-off that was replaced with deposit growth.
In the non-bank, the decrease was primarily due to TLGP run-off, trust
preferred redemptions, debt maturities and debt repurchases through tender
offers or buybacks (see discussion below), partially offset by issuances. While
long-term debt in the non-bank declined over the course of the past year,
Citi correspondingly reduced its overall level of assets—including illiquid
assets—that debt was meant to support. These reductions are in keeping
with Citi’s continued strategy to deleverage its balance sheet and lower
funding costs.
As noted above and as part of its liquidity and funding strategy, Citi has
considered, and may continue to consider, opportunities to repurchase its
long-term and short-term debt pursuant to open market purchases, tender
offers or other means. Such repurchases further decrease Citi’s overall
funding costs. During 2012, Citi repurchased an aggregate of approximately
$11.1 billion of its outstanding long-term and short-term debt, primarily
pursuant to selective public tender offers and open market purchases,
compared to $3.3 billion during 2011.
Citi expects to continue to reduce its outstanding long-term debt during
2013, although it expects such reductions to occur at a more moderate
rate as compared to 2012. These reductions could occur through natural
maturities as well as repurchases, tender offers, redemptions and similar
means, depending upon the overall economic environment.
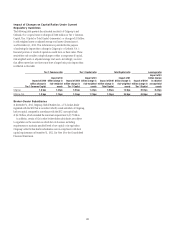
Long-Term Debt Issuances and Maturities
The table below details Citi’s long-term debt issuances and maturities (including repurchases) during the periods presented:
2012 2011 2010
In billions of dollars Maturities Issuances Maturities Issuances Maturities Issuances
Structural long-term debt (1) $ 80.7 $15.1 $47.3 $15.1 $41.2 $18.9
Local country level, FHLB and other (2) 11.7 12.2 25.7 15.2 20.5 10.2
Secured debt and securitizations 25.2 0.5 16.1 0.7 14.2 4.7
Total $ 117.6 $27.8 $89.1 $31.0 $75.9 $33.8
(1) Citi defines structural long-term debt as its long-term debt (original maturities of one year or more), excluding certain structured debt, such as equity-linked and credit-linked notes, with early redemption features
effective within one year. Issuances and maturities of these notes are included in this table in “Local country level, FHLB and other.” See footnote 2 below. Structural long-term debt is a non-GAAP measure. Citigroup
believes that the structural long-term debt measure provides useful information to its investors as it excludes long-term debt that could in fact be redeemed by the holders thereof within one year.
(2) As referenced above, “other” includes long-term debt not considered structural long-term debt relating to certain structured notes. The amounts of issuances included in this line, and thus excluded from “structural
long-term debt,” were $2.0 billion, $3.7 billion, and $3.3 billion in 2012, 2011, and 2010, respectively. The amounts of maturities included in this line, and thus excluded from “structural long-term debt,” were
$2.4 billion, $2.4 billion, and $3.0 billion, in 2012, 2011, and 2010, respectively.