Citibank 2012 Annual Report Download - page 43
Download and view the complete annual report
Please find page 43 of the 2012 Citibank annual report below. You can navigate through the pages in the report by either clicking on the pages listed below, or by using the keyword search tool below to find specific information within the annual report.-
 1
1 -
2
-
3
-
4
-
5
-
6
-
7
-
8
-
9
-
10
-
11
-
12
-
13
-
14
-
15
-
16
-
17
-
18
-
19
-
20
-
21
-
22
-
23
-
24
-
25
-
26
-
27
-
28
-
29
-
30
-
31
-
32
-
 33
33 -
 34
34 -
 35
35 -
 36
36 -
 37
37 -
 38
38 -
 39
39 -
 40
40 -
 41
41 -
 42
42 -
 43
43 -
 44
44 -
 45
45 -
 46
46 -
 47
47 -
 48
48 -
 49
49 -
 50
50 -
 51
51 -
 52
52 -
 53
53 -
54
-
55
-
56
-
57
-
58
-
59
-
60
-
61
-
62
-
63
-
64
-
65
-
66
-
67
-
68
-
69
-
70
-
71
-
72
-
73
-
74
-
75
-
76
-
77
-
78
-
79
-
80
-
81
-
82
-
83
-
84
-
85
-
86
-
87
-
88
-
89
-
90
-
91
-
92
-
93
-
94
-
95
-
96
-
97
-
98
-
99
-
100
-
101
-
102
-
103
-
104
-
105
-
106
-
107
-
108
-
109
-
110
-
111
-
112
-
113
-
114
-
115
-
116
-
117
-
118
-
119
-
120
-
121
-
122
-
123
-
124
-
125
-
126
-
127
-
128
-
129
-
130
-
131
-
132
-
133
-
134
-
135
-
136
-
137
-
138
-
139
-
140
-
141
-
142
-
143
-
144
-
145
-
146
-
147
-
148
-
149
-
150
-
151
-
152
-
153
-
154
-
155
-
156
-
157
-
158
-
159
-
160
-
161
-
162
-
163
-
164
-
165
-
166
-
167
-
168
-
169
-
170
-
171
-
172
-
173
-
174
-
175
-
176
-
177
-
178
-
179
-
180
-
181
-
182
-
183
-
184
-
185
-
186
-
187
-
188
-
189
-
190
-
191
-
192
-
193
-
194
-
195
-
196
-
197
-
198
-
199
-
200
-
201
-
202
-
203
-
204
-
205
-
206
-
207
-
208
-
209
-
210
-
211
-
212
-
213
-
214
-
215
-
216
-
217
-
218
-
219
-
220
-
221
-
222
-
223
-
224
-
225
-
226
-
227
-
228
-
229
-
230
-
231
-
232
-
233
-
234
-
235
-
236
-
237
-
238
-
239
-
240
-
241
-
242
-
243
-
244
-
245
-
246
-
247
-
248
-
249
-
250
-
251
-
252
-
253
-
254
-
255
-
256
-
257
-
258
-
259
-
260
-
261
-
262
-
263
-
264
-
265
-
266
-
267
-
268
-
269
-
270
-
271
-
272
-
273
-
274
-
275
-
276
-
277
-
278
-
279
-
280
-
281
-
282
-
283
-
284
-
285
-
286
-
287
-
288
-
289
-
290
-
291
-
292
-
293
-
294
-
295
-
296
-
297
-
298
-
299
-
300
-
301
-
302
-
303
-
304
-
305
-
306
-
307
-
308
-
309
-
310
-
311
-
312
-
313
-
314
-
315
-
316
-
317
-
318
-
319
-
320
-
321
-
322
-
323
-
324
 |
 |
21
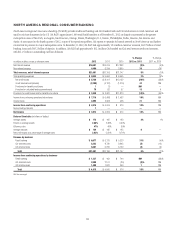
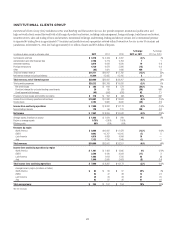
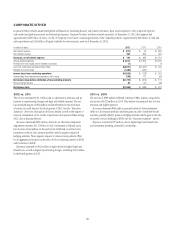
The discussion of the results of operations for Latin America RCB below excludes the impact of FX translation for all periods presented. Presentation
of the results of operations, excluding the impact of FX translation, are non-GAAP financial measures. Citi believes the presentation of Latin America
RCB’s results excluding the impact of FX translation is a more meaningful depiction of the underlying fundamentals of the business. For a
reconciliation of certain of these metrics to the reported results, see the table above.
2012 vs. 2011
Net income was flat to the prior year as higher revenues were offset by higher
credit costs and repositioning charges.
Revenues increased 9%, primarily due to strong revenue growth in
Mexico and higher volumes, mostly related to personal loans and credit
cards. However, continued regulatory pressure involving foreign exchange
controls and related measures in Argentina and Venezuela is expected to
negatively impact revenues in the near term. Net interest revenue increased
10% due to increased volumes, partially offset by continued spread
compression. Citi expects spread compression to continue to negatively
impact revenues in this business during 2013. Non-interest revenue increased
7%, primarily due to increased business volumes in the private pension fund
and insurance businesses.
Expenses increased 6%, primarily due to $131 million of repositioning
charges in the fourth quarter of 2012, higher volume-driven expenses and
increased legal and related costs.
Provisions increased 39%, primarily due to increased loan loss reserve
builds driven by underlying business volume growth, primarily in Mexico
and Colombia. In addition, net credit losses increased in the retail portfolios,
primarily in Mexico, reflecting volume growth. Citi believes that net credit
losses in Latin America will likely continue to trend higher as various loan
portfolios continue to mature.
2011 vs. 2010
Net income declined 14% as higher revenues were more than offset by higher
expenses and higher credit costs.
Revenues increased 7% primarily due to higher volumes. Net interest
revenue increased 6% driven by the continued growth in lending and
deposit volumes, partially offset by spread compression driven in part by
the continued move toward customers with a lower risk profile and stricter
underwriting criteria, especially in the Citi-branded cards portfolio. Non-
interest revenue increased 8%, primarily driven by an increase in banking fee
income from credit card purchase sales.
Expenses increased 10% due to higher volumes and investment spending,
including increased marketing and customer acquisition costs as well as new
branches, partially offset by continued savings initiatives. The increase in the
level of investment spending in the business was largely completed at the end
of 2011.
Provisions increased 43%, reflecting lower loan loss reserve releases. Net
credit losses declined 13%, driven primarily by improvements in the Mexico
cards portfolio due to the move toward customers with a lower-risk profile
and stricter underwriting criteria.