Citibank 2012 Annual Report Download - page 107
Download and view the complete annual report
Please find page 107 of the 2012 Citibank annual report below. You can navigate through the pages in the report by either clicking on the pages listed below, or by using the keyword search tool below to find specific information within the annual report.-
 1
1 -
2
-
3
-
4
-
5
-
6
-
7
-
8
-
9
-
10
-
11
-
12
-
13
-
14
-
15
-
16
-
17
-
18
-
19
-
20
-
21
-
22
-
23
-
24
-
25
-
26
-
27
-
28
-
29
-
30
-
31
-
32
-
33
-
34
-
35
-
36
-
37
-
38
-
39
-
40
-
41
-
42
-
43
-
44
-
45
-
46
-
47
-
48
-
49
-
50
-
51
-
52
-
53
-
54
-
55
-
56
-
57
-
58
-
59
-
60
-
61
-
62
-
63
-
64
-
65
-
66
-
67
-
68
-
69
-
70
-
71
-
72
-
73
-
74
-
75
-
76
-
77
-
78
-
79
-
80
-
81
-
82
-
83
-
84
-
85
-
86
-
87
-
88
-
89
-
90
-
91
-
92
-
93
-
94
-
95
-
96
-
 97
97 -
 98
98 -
 99
99 -
 100
100 -
 101
101 -
 102
102 -
 103
103 -
 104
104 -
 105
105 -
 106
106 -
 107
107 -
 108
108 -
 109
109 -
 110
110 -
 111
111 -
 112
112 -
 113
113 -
 114
114 -
 115
115 -
 116
116 -
 117
117 -
118
-
119
-
120
-
121
-
122
-
123
-
124
-
125
-
126
-
127
-
128
-
129
-
130
-
131
-
132
-
133
-
134
-
135
-
136
-
137
-
138
-
139
-
140
-
141
-
142
-
143
-
144
-
145
-
146
-
147
-
148
-
149
-
150
-
151
-
152
-
153
-
154
-
155
-
156
-
157
-
158
-
159
-
160
-
161
-
162
-
163
-
164
-
165
-
166
-
167
-
168
-
169
-
170
-
171
-
172
-
173
-
174
-
175
-
176
-
177
-
178
-
179
-
180
-
181
-
182
-
183
-
184
-
185
-
186
-
187
-
188
-
189
-
190
-
191
-
192
-
193
-
194
-
195
-
196
-
197
-
198
-
199
-
200
-
201
-
202
-
203
-
204
-
205
-
206
-
207
-
208
-
209
-
210
-
211
-
212
-
213
-
214
-
215
-
216
-
217
-
218
-
219
-
220
-
221
-
222
-
223
-
224
-
225
-
226
-
227
-
228
-
229
-
230
-
231
-
232
-
233
-
234
-
235
-
236
-
237
-
238
-
239
-
240
-
241
-
242
-
243
-
244
-
245
-
246
-
247
-
248
-
249
-
250
-
251
-
252
-
253
-
254
-
255
-
256
-
257
-
258
-
259
-
260
-
261
-
262
-
263
-
264
-
265
-
266
-
267
-
268
-
269
-
270
-
271
-
272
-
273
-
274
-
275
-
276
-
277
-
278
-
279
-
280
-
281
-
282
-
283
-
284
-
285
-
286
-
287
-
288
-
289
-
290
-
291
-
292
-
293
-
294
-
295
-
296
-
297
-
298
-
299
-
300
-
301
-
302
-
303
-
304
-
305
-
306
-
307
-
308
-
309
-
310
-
311
-
312
-
313
-
314
-
315
-
316
-
317
-
318
-
319
-
320
-
321
-
322
-
323
-
324
 |
 |
85
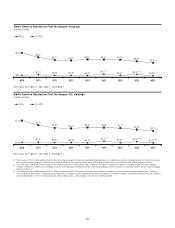
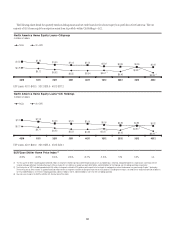
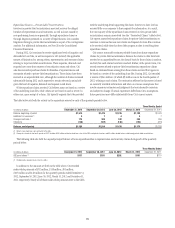
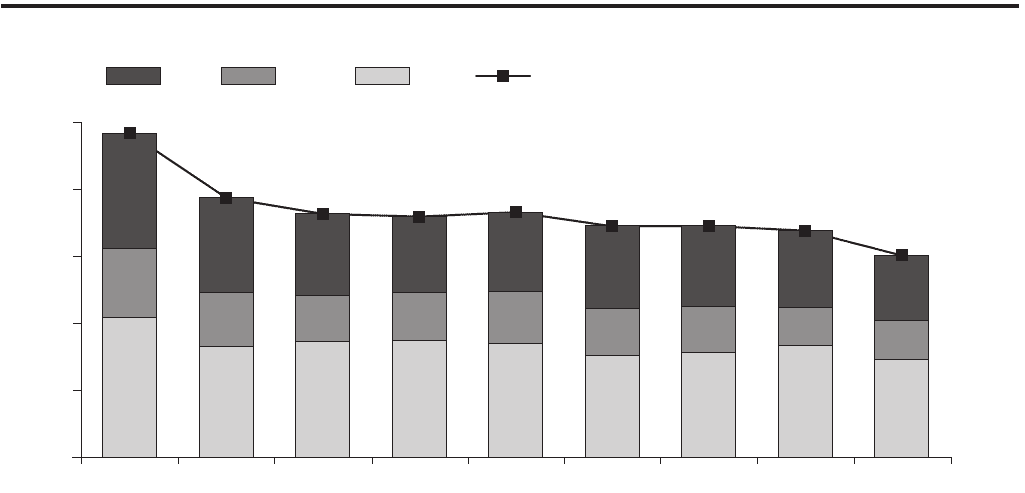
North America Residential First Mortgage Delinquencies—Citi Holdings
In billions of dollars
Days Past Due:
0
2
4
6
8
10
30+ DPD180+ 90-179 30-89
4Q123Q122Q121Q124Q113Q112Q111Q114Q10
4.19 3.30 3.45 3.49 3.39 3.03 3.14 3.33 2.91
2.06
1.61 1.38 1.43 1.57 1.41 1.37 1.16 1.17
3.43
2.84 2.44 2.26 2.36 2.47 2.41
1.95
2.28
9.68
7.75 7.27 7.19 7.32 6.90 6.91 6.77
6.03
Note: For each of the tables above, past due exclude (i) U.S. mortgage loans that are guaranteed by U.S. government-sponsored agencies because the potential loss predominantly resides with the U.S. agencies, and (ii)
loans recorded at fair value. Totals may not sum due to rounding.
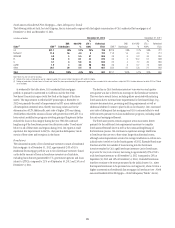
Management actions, primarily asset sales and to a lesser extent
modification programs, continued to be the primary drivers of the overall
improved asset performance within Citi’s residential first mortgage portfolio
in Citi Holdings during the periods presented above (excluding the impacts to
net credit losses described in the notes to the tables above).
Citi sold approximately $2.1 billion of delinquent residential first
mortgages during 2012, including $0.6 billion during the fourth quarter of
2012. Since the beginning of 2010, Citi has sold approximately $9.6 billion of
delinquent residential mortgages.
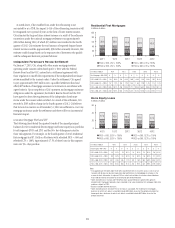
In addition, Citi modified approximately $0.9 billion and $0.3 billion
of residential first mortgage loans during 2012 and in the fourth quarter of
2012, respectively, including loan modifications pursuant to the national
mortgage settlement. (For additional information on Citi’s residential first
mortgage loan modifications, see Note 16 to the Consolidated Financial
Statements.) Loan modifications under the national mortgage settlement
have improved Citi’s 30+ days past due delinquencies by approximately
$249 million as of the end of 2012. While re-defaults of previously modified
mortgages under the HAMP and Citi Supplemental Modification (CSM)
programs continued to track favorably versus expectations as of December 31,
2012, Citi’s residential first mortgage portfolio continued to show some signs
of the impact of re-defaults of previously modified mortgages.
Citi believes that its ability to offset increasing delinquencies or net credit
losses in its residential first mortgage portfolio, due to any deterioration of
the underlying credit performance of these loans, re-defaults, the lengthening
of the foreclosure process (see “Foreclosures” below) or otherwise, pursuant
to asset sales or modifications could be limited going forward as a result of
the lower remaining inventory of loans to sell or modify or due to lack of
market demand for asset sales. Citi has taken these trends and uncertainties,
including the potential for re-defaults, into consideration in determining its
loan loss reserves. See “North America Consumer Mortgages—Loan Loss
Reserve Coverage” below.