Citibank 2012 Annual Report Download - page 153
Download and view the complete annual report
Please find page 153 of the 2012 Citibank annual report below. You can navigate through the pages in the report by either clicking on the pages listed below, or by using the keyword search tool below to find specific information within the annual report.-
 1
1 -
2
-
3
-
4
-
5
-
6
-
7
-
8
-
9
-
10
-
11
-
12
-
13
-
14
-
15
-
16
-
17
-
18
-
19
-
20
-
21
-
22
-
23
-
24
-
25
-
26
-
27
-
28
-
29
-
30
-
31
-
32
-
33
-
34
-
35
-
36
-
37
-
38
-
39
-
40
-
41
-
42
-
43
-
44
-
45
-
46
-
47
-
48
-
49
-
50
-
51
-
52
-
53
-
54
-
55
-
56
-
57
-
58
-
59
-
60
-
61
-
62
-
63
-
64
-
65
-
66
-
67
-
68
-
69
-
70
-
71
-
72
-
73
-
74
-
75
-
76
-
77
-
78
-
79
-
80
-
81
-
82
-
83
-
84
-
85
-
86
-
87
-
88
-
89
-
90
-
91
-
92
-
93
-
94
-
95
-
96
-
97
-
98
-
99
-
100
-
101
-
102
-
103
-
104
-
105
-
106
-
107
-
108
-
109
-
110
-
111
-
112
-
113
-
114
-
115
-
116
-
117
-
118
-
119
-
120
-
121
-
122
-
123
-
124
-
125
-
126
-
127
-
128
-
129
-
130
-
131
-
132
-
133
-
134
-
135
-
136
-
137
-
138
-
139
-
140
-
141
-
142
-
 143
143 -
 144
144 -
 145
145 -
 146
146 -
 147
147 -
 148
148 -
 149
149 -
 150
150 -
 151
151 -
 152
152 -
 153
153 -
 154
154 -
 155
155 -
 156
156 -
 157
157 -
 158
158 -
 159
159 -
 160
160 -
 161
161 -
 162
162 -
 163
163 -
164
-
165
-
166
-
167
-
168
-
169
-
170
-
171
-
172
-
173
-
174
-
175
-
176
-
177
-
178
-
179
-
180
-
181
-
182
-
183
-
184
-
185
-
186
-
187
-
188
-
189
-
190
-
191
-
192
-
193
-
194
-
195
-
196
-
197
-
198
-
199
-
200
-
201
-
202
-
203
-
204
-
205
-
206
-
207
-
208
-
209
-
210
-
211
-
212
-
213
-
214
-
215
-
216
-
217
-
218
-
219
-
220
-
221
-
222
-
223
-
224
-
225
-
226
-
227
-
228
-
229
-
230
-
231
-
232
-
233
-
234
-
235
-
236
-
237
-
238
-
239
-
240
-
241
-
242
-
243
-
244
-
245
-
246
-
247
-
248
-
249
-
250
-
251
-
252
-
253
-
254
-
255
-
256
-
257
-
258
-
259
-
260
-
261
-
262
-
263
-
264
-
265
-
266
-
267
-
268
-
269
-
270
-
271
-
272
-
273
-
274
-
275
-
276
-
277
-
278
-
279
-
280
-
281
-
282
-
283
-
284
-
285
-
286
-
287
-
288
-
289
-
290
-
291
-
292
-
293
-
294
-
295
-
296
-
297
-
298
-
299
-
300
-
301
-
302
-
303
-
304
-
305
-
306
-
307
-
308
-
309
-
310
-
311
-
312
-
313
-
314
-
315
-
316
-
317
-
318
-
319
-
320
-
321
-
322
-
323
-
324
 |
 |

131
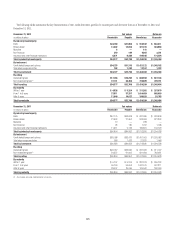
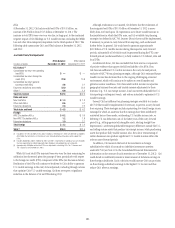
DTAs
At December 31, 2012, Citi had recorded net DTAs of $55.3 billion, an
increase of $3.8 billion from $51.5 billion at December 31, 2011. The
increase in total DTAs year-over-year was due, in large part, to the continued
negative impact of Citi Holdings on U.S. taxable income, including the MSSB
loss and other-than-temporary impairment in the third quarter of 2012. The
following table summarizes Citi’s net DTAs balance at December 31, 2012
and 2011:
Jurisdiction/Component
DTAs balance DTAs balance
In billions of dollars December 31, 2012 December 31, 2011
U.S. federal (1)
Consolidated tax return net operating
loss (NOL) $ — $ —
Consolidated tax return foreign tax
credit (FTC) 22.0 15.8
Consolidated tax return general
business credit (GBC) 2.6 2.1
Future tax deductions and credits 22.0 23.0
Other (2) 0.9 1.4
Total U.S. federal $47.5 $42.3
State and local
New York NOLs $ 1.3 $ 1.3
Other state NOLs 0.6 0.7
Future tax deductions 2.6 2.2
Total state and local $ 4.5 $ 4.2
Foreign
APB 23 subsidiary NOLs $ 0.2 $ 0.5
Non-APB 23 subsidiary NOLs 1.2 1.8
Future tax deductions 1.9 2.7
Total foreign $ 3.3 $ 5.0
Total (3) $55.3 $51.5
(1) Included in the net U.S. federal DTAs of $47.5 billion at December 31, 2012 are deferred tax liabilities
of $2 billion that will reverse in the relevant carry-forward period and may be used to support the
DTAs.
(2) Includes $0.8 billion and $1.2 billion for 2012 and 2011, respectively, of subsidiary tax carry-forwards
that are expected to be utilized separately from Citigroup’s consolidated tax carry-forwards.
(3) Approximately $40 billion of the total DTAs was deducted in calculating Citi’s Tier 1 Common and
Tier 1 Capital as of December 31, 2012.
While Citi’s net total DTAs increased year-over-year, the time remaining for
utilization has shortened, given the passage of time, particularly with respect
to the foreign tax credit (FTC) component of the DTAs (see discussion below).
Realization of the DTAs will continue to be driven by Citi’s ability to generate
U.S. taxable earnings in the carry-forward periods, including through actions
that optimize Citi’s U.S. taxable earnings. Citi does not expect a significant
reduction in the balance of its net DTAs during 2013.
Although realization is not assured, Citi believes that the realization of
the recognized net DTAs of $55.3 billion at December 31, 2012 is more-
likely-than-not based upon (i) expectations as to future taxable income in
the jurisdictions in which the DTAs arise, and (ii) available tax planning
strategies (as defined in ASC 740, Income Taxes) that would be implemented,
if necessary, to prevent a carry-forward from expiring, each as discussed
further below. In general, Citi would need to generate approximately
$112 billion of U.S. taxable income during the respective carry-forward
periods, substantially all of which must be generated during the FTC carry-
forward periods (as discussed below), to fully realize its U.S. federal, state and
local DTAs.
As referenced above, Citi has concluded that there are two components
of positive evidence that support the full realizability of its DTAs. First,
Citi forecasts sufficient U.S. taxable income in the carry-forward periods,
exclusive of ASC 740 tax planning strategies, although Citi’s estimated future
taxable income has decreased due to the ongoing challenging economic
environment, which will continue to be subject to overall market and
global economic conditions. Citi’s forecasted taxable income incorporates
geographic business forecasts and taxable income adjustments to those
forecasts (e.g., U.S. tax exempt income, loan loss reserves deductible for U.S.
tax reporting in subsequent years), and actions intended to optimize its U.S.
taxable earnings.
Second, Citi has sufficient tax planning strategies available to it under
ASC 740 that would be implemented, if necessary, to prevent a carry-forward
from expiring. These strategies include repatriating low-taxed foreign source
earnings for which an assertion that the earnings have been indefinitely
reinvested has not been made, accelerating U.S. taxable income into, or
deferring U.S. tax deductions out of, the latter years of the carry-forward
period (e.g., selling appreciated intangible assets, electing straight-line
depreciation), accelerating deductible temporary differences outside the U.S.,
and selling certain assets that produce tax-exempt income, while purchasing
assets that produce fully taxable income. Also, the sale or restructuring of
certain businesses can produce significant U.S. taxable income within the
relevant carry-forward periods.
In addition, Citi monitors the level of its investments in foreign
subsidiaries for which it has made an indefinite investment assertion
under ASC 740 (see Note 10 to the Consolidated Financial Statements for
information on the amount of such assertions as of December 31, 2012). Citi
could decide to indefinitely reinvest a lesser amount of its future earnings in
these foreign subsidiaries. Such a decision would increase Citi’s tax provision
on these foreign subsidiary earnings to the higher U.S. tax rate and thus
reduce Citi’s after-tax earnings.