Citibank 2012 Annual Report Download - page 219
Download and view the complete annual report
Please find page 219 of the 2012 Citibank annual report below. You can navigate through the pages in the report by either clicking on the pages listed below, or by using the keyword search tool below to find specific information within the annual report.-
 1
1 -
2
-
3
-
4
-
5
-
6
-
7
-
8
-
9
-
10
-
11
-
12
-
13
-
14
-
15
-
16
-
17
-
18
-
19
-
20
-
21
-
22
-
23
-
24
-
25
-
26
-
27
-
28
-
29
-
30
-
31
-
32
-
33
-
34
-
35
-
36
-
37
-
38
-
39
-
40
-
41
-
42
-
43
-
44
-
45
-
46
-
47
-
48
-
49
-
50
-
51
-
52
-
53
-
54
-
55
-
56
-
57
-
58
-
59
-
60
-
61
-
62
-
63
-
64
-
65
-
66
-
67
-
68
-
69
-
70
-
71
-
72
-
73
-
74
-
75
-
76
-
77
-
78
-
79
-
80
-
81
-
82
-
83
-
84
-
85
-
86
-
87
-
88
-
89
-
90
-
91
-
92
-
93
-
94
-
95
-
96
-
97
-
98
-
99
-
100
-
101
-
102
-
103
-
104
-
105
-
106
-
107
-
108
-
109
-
110
-
111
-
112
-
113
-
114
-
115
-
116
-
117
-
118
-
119
-
120
-
121
-
122
-
123
-
124
-
125
-
126
-
127
-
128
-
129
-
130
-
131
-
132
-
133
-
134
-
135
-
136
-
137
-
138
-
139
-
140
-
141
-
142
-
143
-
144
-
145
-
146
-
147
-
148
-
149
-
150
-
151
-
152
-
153
-
154
-
155
-
156
-
157
-
158
-
159
-
160
-
161
-
162
-
163
-
164
-
165
-
166
-
167
-
168
-
169
-
170
-
171
-
172
-
173
-
174
-
175
-
176
-
177
-
178
-
179
-
180
-
181
-
182
-
183
-
184
-
185
-
186
-
187
-
188
-
189
-
190
-
191
-
192
-
193
-
194
-
195
-
196
-
197
-
198
-
199
-
200
-
201
-
202
-
203
-
204
-
205
-
206
-
207
-
208
-
 209
209 -
 210
210 -
 211
211 -
 212
212 -
 213
213 -
 214
214 -
 215
215 -
 216
216 -
 217
217 -
 218
218 -
 219
219 -
 220
220 -
 221
221 -
 222
222 -
 223
223 -
 224
224 -
 225
225 -
 226
226 -
 227
227 -
 228
228 -
 229
229 -
230
-
231
-
232
-
233
-
234
-
235
-
236
-
237
-
238
-
239
-
240
-
241
-
242
-
243
-
244
-
245
-
246
-
247
-
248
-
249
-
250
-
251
-
252
-
253
-
254
-
255
-
256
-
257
-
258
-
259
-
260
-
261
-
262
-
263
-
264
-
265
-
266
-
267
-
268
-
269
-
270
-
271
-
272
-
273
-
274
-
275
-
276
-
277
-
278
-
279
-
280
-
281
-
282
-
283
-
284
-
285
-
286
-
287
-
288
-
289
-
290
-
291
-
292
-
293
-
294
-
295
-
296
-
297
-
298
-
299
-
300
-
301
-
302
-
303
-
304
-
305
-
306
-
307
-
308
-
309
-
310
-
311
-
312
-
313
-
314
-
315
-
316
-
317
-
318
-
319
-
320
-
321
-
322
-
323
-
324
 |
 |
197
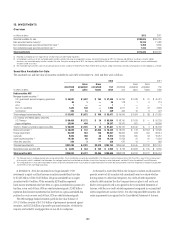
For impaired equity method investments that management does not plan
to sell prior to recovery of value and is not likely to be required to sell, the
evaluation of whether an impairment is other-than-temporary is based on
(i) whether and when an equity method investment will recover in value and
(ii) whether the investor has the intent and ability to hold that investment for
a period of time sufficient to recover the value. The determination of whether
the impairment is considered other-than-temporary is based on all of the
following indicators, regardless of the time and extent of impairment:
• Cause of the impairment and the financial condition and near-term
prospects of the issuer, including any specific events that may influence
the operations of the issuer;
• Intent and ability to hold the investment for a period of time sufficient to
allow for any anticipated recovery in market value; and
• Length of time and extent to which fair value has been less than the
carrying value.
The sections below describe current circumstances related to certain of
the Company’s significant equity method investments, specific impairments
and the Company’s process for identifying credit-related impairments
in its security types with the most significant unrealized losses as of
December 31, 2012.
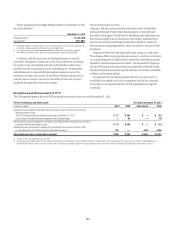
Akbank
In March 2012, Citi decided to reduce its ownership interest in Akbank
T.A.S., an equity investment in Turkey (Akbank), to below 10%. As of
March 31, 2012, Citi held a 20% equity interest in Akbank, which it purchased
in January 2007, accounted for as an equity method investment. As a result
of its decision to sell its share holdings in Akbank, in the first quarter of
2012 Citi recorded an impairment charge related to its total investment
in Akbank amounting to approximately $1.2 billion pretax ($763 million
after-tax). This impairment charge was primarily driven by the recognition
of all net investment foreign currency hedging and translation losses
previously reflected in AOCI as well as a reduction in the carrying value of the
investment to reflect the market price of Akbank’s shares. The impairment
charge was recorded in other-than-temporary impairment losses on
investments in the Consolidated Statement of Income. During the second
quarter of 2012, Citi sold a 10.1% stake in Akbank, resulting in a loss on sale
of $424 million ($274 million after-tax), recorded in Other revenue. As of
December 31, 2012, the remaining 9.9% stake in Akbank is recorded within
marketable equity securities available-for-sale.
MSSB
On September 17, 2012, Citi sold to Morgan Stanley a 14% interest (the
“14% Interest”) in MSSB, to which Morgan Stanley exercised its purchase
option on June 1, 2012. Morgan Stanley paid to Citi $1.89 billion in cash as
the purchase price of the 14% Interest. The purchase price was based on an
implied 100% valuation of MSSB of $13.5 billion, as agreed between Morgan
Stanley and Citi pursuant to an agreement dated September 11, 2012. The
related approximate $4.5 billion in deposits were transferred to Morgan
Stanley at no premium, as agreed between the parties.
In addition, Morgan Stanley has agreed, subject to obtaining regulatory
approval, to purchase Citi’s remaining 35% interest in MSSB no later than
June 1, 2015 at a purchase price of $4.725 billion, which is based on the
same implied 100% valuation of MSSB of $13.5 billion.
Prior to the September 2012 sale, Citi’s carrying value of its 49% interest
in MSSB was approximately $11.3 billion. As a result of the agreement
entered into with Morgan Stanley on September 11, 2012, Citi recorded
a charge to net income in the third quarter of 2012 of approximately
$2.9 billion after-tax ($4.7 billion pretax), consisting of (i) a charge recorded
in Other revenue of approximately $800 million after-tax ($1.3 billion
pretax), representing a loss on sale of the 14% Interest, and (ii) an
other-than-temporary impairment of the carrying value of its remaining 35%
interest in MSSB of approximately $2.1 billion after-tax ($3.4 billion pretax).
As of December 31, 2012, Citi continues to account for its remaining 35%
interest in MSSB under the equity method, with the carrying value capped at
the agreed selling price of $4.725 billion.
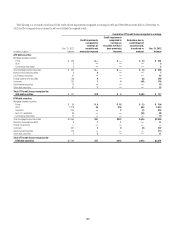
Mortgage-backed securities
For U.S. mortgage-backed securities (and in particular for Alt-A and other
mortgage-backed securities that have significant unrealized losses as a
percentage of amortized cost), credit impairment is assessed using a cash
flow model that estimates the cash flows on the underlying mortgages, using
the security-specific collateral and transaction structure. The model estimates
cash flows from the underlying mortgage loans and distributes those cash
flows to various tranches of securities, considering the transaction structure
and any subordination and credit enhancements that exist in that structure.
The cash flow model incorporates actual cash flows on the mortgage-backed
securities through the current period and then projects the remaining cash
flows using a number of assumptions, including default rates, prepayment
rates and recovery rates (on foreclosed properties).
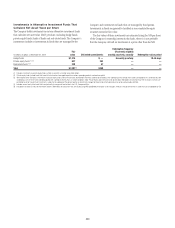
Management develops specific assumptions using as much market data
as possible and includes internal estimates as well as estimates published
by rating agencies and other third-party sources. Default rates are projected
by considering current underlying mortgage loan performance, generally
assuming the default of (i) 10% of current loans, (ii) 25% of 30–59 day
delinquent loans, (iii) 70% of 60–90 day delinquent loans and (4) 100%
of 91+ day delinquent loans. These estimates are extrapolated along a
default timing curve to estimate the total lifetime pool default rate. Other
assumptions contemplate the actual collateral attributes, including
geographic concentrations, rating agency loss projections, rating actions and
current market prices.