Citibank 2012 Annual Report Download - page 40
Download and view the complete annual report
Please find page 40 of the 2012 Citibank annual report below. You can navigate through the pages in the report by either clicking on the pages listed below, or by using the keyword search tool below to find specific information within the annual report.-
 1
1 -
2
-
3
-
4
-
5
-
6
-
7
-
8
-
9
-
10
-
11
-
12
-
13
-
14
-
15
-
16
-
17
-
18
-
19
-
20
-
21
-
22
-
23
-
24
-
25
-
26
-
27
-
28
-
29
-
 30
30 -
 31
31 -
 32
32 -
 33
33 -
 34
34 -
 35
35 -
 36
36 -
 37
37 -
 38
38 -
 39
39 -
 40
40 -
 41
41 -
 42
42 -
 43
43 -
 44
44 -
 45
45 -
 46
46 -
 47
47 -
 48
48 -
 49
49 -
 50
50 -
51
-
52
-
53
-
54
-
55
-
56
-
57
-
58
-
59
-
60
-
61
-
62
-
63
-
64
-
65
-
66
-
67
-
68
-
69
-
70
-
71
-
72
-
73
-
74
-
75
-
76
-
77
-
78
-
79
-
80
-
81
-
82
-
83
-
84
-
85
-
86
-
87
-
88
-
89
-
90
-
91
-
92
-
93
-
94
-
95
-
96
-
97
-
98
-
99
-
100
-
101
-
102
-
103
-
104
-
105
-
106
-
107
-
108
-
109
-
110
-
111
-
112
-
113
-
114
-
115
-
116
-
117
-
118
-
119
-
120
-
121
-
122
-
123
-
124
-
125
-
126
-
127
-
128
-
129
-
130
-
131
-
132
-
133
-
134
-
135
-
136
-
137
-
138
-
139
-
140
-
141
-
142
-
143
-
144
-
145
-
146
-
147
-
148
-
149
-
150
-
151
-
152
-
153
-
154
-
155
-
156
-
157
-
158
-
159
-
160
-
161
-
162
-
163
-
164
-
165
-
166
-
167
-
168
-
169
-
170
-
171
-
172
-
173
-
174
-
175
-
176
-
177
-
178
-
179
-
180
-
181
-
182
-
183
-
184
-
185
-
186
-
187
-
188
-
189
-
190
-
191
-
192
-
193
-
194
-
195
-
196
-
197
-
198
-
199
-
200
-
201
-
202
-
203
-
204
-
205
-
206
-
207
-
208
-
209
-
210
-
211
-
212
-
213
-
214
-
215
-
216
-
217
-
218
-
219
-
220
-
221
-
222
-
223
-
224
-
225
-
226
-
227
-
228
-
229
-
230
-
231
-
232
-
233
-
234
-
235
-
236
-
237
-
238
-
239
-
240
-
241
-
242
-
243
-
244
-
245
-
246
-
247
-
248
-
249
-
250
-
251
-
252
-
253
-
254
-
255
-
256
-
257
-
258
-
259
-
260
-
261
-
262
-
263
-
264
-
265
-
266
-
267
-
268
-
269
-
270
-
271
-
272
-
273
-
274
-
275
-
276
-
277
-
278
-
279
-
280
-
281
-
282
-
283
-
284
-
285
-
286
-
287
-
288
-
289
-
290
-
291
-
292
-
293
-
294
-
295
-
296
-
297
-
298
-
299
-
300
-
301
-
302
-
303
-
304
-
305
-
306
-
307
-
308
-
309
-
310
-
311
-
312
-
313
-
314
-
315
-
316
-
317
-
318
-
319
-
320
-
321
-
322
-
323
-
324
 |
 |

18
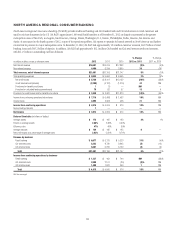
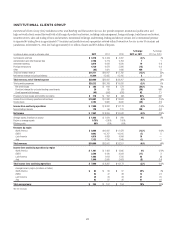
EMEA REGIONAL CONSUMER BANKING
EMEA Regional Consumer Banking (EMEA RCB) provides traditional banking and Citi-branded card services to retail customers and small to mid-size
businesses, primarily in Central and Eastern Europe, the Middle East and Africa. The countries in which EMEA RCB has the largest presence are Poland, Turkey,
Russia and the United Arab Emirates. As announced in the fourth quarter of 2012, as part of its repositioning efforts, Citi expects to either sell or significantly
scale back its consumer operations in Turkey, Romania and Pakistan, and expects to further optimize its branch network in Hungary. At December 31, 2012,
EMEA RCB had 228 retail bank branches with 3.9 million customer accounts, $5.1 billion in retail banking loans and $13.2 billion in deposits. In addition, the
business had 2.8 million Citi-branded card accounts with $2.9 billion in outstanding card loan balances.
In millions of dollars, except as otherwise noted 2012 2011 2010
% Change
2012 vs. 2011
% Change
2011 vs. 2010
Net interest revenue $ 1,040 $ 947 $ 936 10% 1%
Non-interest revenue 476 611 623 (22) (2)
Total revenues, net of interest expense $1,516 $ 1,558 $ 1,559 (3)% —%
Total operating expenses $ 1,434 $ 1,343 $ 1,225 7% 10%
Net credit losses $ 105 $ 172 $ 315 (39)% (45)%
Credit reserve build (release) (5) (118) (118) 96 —
Provision for unfunded lending commitments (1) 4 (3) NM NM
Provisions for credit losses $ 99 $ 58 $ 194 71% (70)%
Income from continuing operations before taxes $ (17) $ 157 $ 140 NM 12%
Income taxes 162 43 (98) 44
Income from continuing operations $ (18) $ 95 $ 97 NM (2)%
Noncontrolling interests 4— (1) —100
Net income $ (22) $ 95 $ 98 NM (3)%
Balance Sheet data (in billions of dollars)
Average assets $ 9 $ 10 10 (10)% —%
Return on average assets (0.24)% 0.95% 0.98%
Efficiency ratio 95% 86% 79%
Average deposits $ 12.6 $ 12.5 $ 13.7 1(9)
Net credit losses as a percentage of average loans 1.40% 2.37% 4.42%
Revenue by business
Retail banking $ 889 $ 890 $ 878 —1%
Citi-branded cards 627 668 681 (6) (2)
Total $ 1,516 $ 1,558 $ 1,559 (3)% —%
Income (loss) from continuing operations by business
Retail banking $ (81) $ (37) $ (59) NM 37%
Citi-branded cards 63 132 156 (52) (15)
Total $ (18) $ 95 $ 97 NM (2)%
Foreign Currency (FX) Translation Impact
Total revenue—as reported $ 1,516 $ 1,558 $ 1,559 (3)% —%
Impact of FX translation (1) —(75) (55)
Total revenues—ex-FX $1,516 $ 1,483 $ 1,504 2% (1)%
Total operating expenses—as reported $1,434 $ 1,343 $ 1,225 7% 10%
Impact of FX translation (1) —(66) (34)
Total operating expenses—ex-FX $1,434 $ 1,277 $ 1,191 12% 7%
Provisions for credit losses—as reported $ 99 $ 58 $ 194 71% (70)%
Impact of FX translation (1) —(2) (7)
Provisions for credit losses—ex-FX $ 99 $ 56 $ 187 77% (70)%
Net income—as reported $ (22) $ 95 $ 98 NM (3)%
Impact of FX translation (1) —(11) (13)
Net income—ex-FX $ (22) $ 84 $ 85 NM (1)%
(1) Reflects the impact of foreign exchange (FX) translation into U.S. dollars at the current exchange rate for all periods presented.
NM Not meaningful