Citibank 2012 Annual Report Download - page 185
Download and view the complete annual report
Please find page 185 of the 2012 Citibank annual report below. You can navigate through the pages in the report by either clicking on the pages listed below, or by using the keyword search tool below to find specific information within the annual report.-
 1
1 -
2
-
3
-
4
-
5
-
6
-
7
-
8
-
9
-
10
-
11
-
12
-
13
-
14
-
15
-
16
-
17
-
18
-
19
-
20
-
21
-
22
-
23
-
24
-
25
-
26
-
27
-
28
-
29
-
30
-
31
-
32
-
33
-
34
-
35
-
36
-
37
-
38
-
39
-
40
-
41
-
42
-
43
-
44
-
45
-
46
-
47
-
48
-
49
-
50
-
51
-
52
-
53
-
54
-
55
-
56
-
57
-
58
-
59
-
60
-
61
-
62
-
63
-
64
-
65
-
66
-
67
-
68
-
69
-
70
-
71
-
72
-
73
-
74
-
75
-
76
-
77
-
78
-
79
-
80
-
81
-
82
-
83
-
84
-
85
-
86
-
87
-
88
-
89
-
90
-
91
-
92
-
93
-
94
-
95
-
96
-
97
-
98
-
99
-
100
-
101
-
102
-
103
-
104
-
105
-
106
-
107
-
108
-
109
-
110
-
111
-
112
-
113
-
114
-
115
-
116
-
117
-
118
-
119
-
120
-
121
-
122
-
123
-
124
-
125
-
126
-
127
-
128
-
129
-
130
-
131
-
132
-
133
-
134
-
135
-
136
-
137
-
138
-
139
-
140
-
141
-
142
-
143
-
144
-
145
-
146
-
147
-
148
-
149
-
150
-
151
-
152
-
153
-
154
-
155
-
156
-
157
-
158
-
159
-
160
-
161
-
162
-
163
-
164
-
165
-
166
-
167
-
168
-
169
-
170
-
171
-
172
-
173
-
174
-
 175
175 -
 176
176 -
 177
177 -
 178
178 -
 179
179 -
 180
180 -
 181
181 -
 182
182 -
 183
183 -
 184
184 -
 185
185 -
 186
186 -
 187
187 -
 188
188 -
 189
189 -
 190
190 -
 191
191 -
 192
192 -
 193
193 -
 194
194 -
 195
195 -
196
-
197
-
198
-
199
-
200
-
201
-
202
-
203
-
204
-
205
-
206
-
207
-
208
-
209
-
210
-
211
-
212
-
213
-
214
-
215
-
216
-
217
-
218
-
219
-
220
-
221
-
222
-
223
-
224
-
225
-
226
-
227
-
228
-
229
-
230
-
231
-
232
-
233
-
234
-
235
-
236
-
237
-
238
-
239
-
240
-
241
-
242
-
243
-
244
-
245
-
246
-
247
-
248
-
249
-
250
-
251
-
252
-
253
-
254
-
255
-
256
-
257
-
258
-
259
-
260
-
261
-
262
-
263
-
264
-
265
-
266
-
267
-
268
-
269
-
270
-
271
-
272
-
273
-
274
-
275
-
276
-
277
-
278
-
279
-
280
-
281
-
282
-
283
-
284
-
285
-
286
-
287
-
288
-
289
-
290
-
291
-
292
-
293
-
294
-
295
-
296
-
297
-
298
-
299
-
300
-
301
-
302
-
303
-
304
-
305
-
306
-
307
-
308
-
309
-
310
-
311
-
312
-
313
-
314
-
315
-
316
-
317
-
318
-
319
-
320
-
321
-
322
-
323
-
324
 |
 |

163
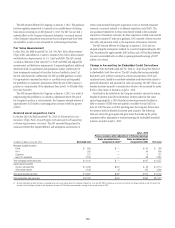
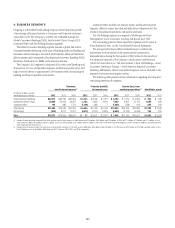
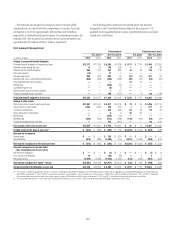
4. BUSINESS SEGMENTS
Citigroup is a diversified bank holding company whose businesses provide
a broad range of financial services to Consumer and Corporate customers
around the world. The Company’s activities are conducted through the
Global Consumer Banking (GCB), Institutional Clients Group (ICG),
Corporate/Other and Citi Holdings business segments.
The Global Consumer Banking segment includes a global, full-service
Consumer franchise delivering a wide array of banking, credit card lending and
investment services through a network of local branches, offices and electronic
delivery systems and is composed of four Regional Consumer Banking (RCB)
businesses: North America, EMEA, Latin America and Asia.
The Company’s ICG segment is composed of Securities and Banking and
Transaction Services and provides corporate, institutional, public sector and
high net-worth clients in approximately 100 countries with a broad range of
banking and financial products and services.
Corporate/Other includes net treasury results, unallocated corporate
expenses, offsets to certain line-item reclassifications (eliminations), the
results of discontinued operations and unallocated taxes.
The Citi Holdings segment is composed of Brokerage and Asset
Management, Local Consumer Lending and Special Asset Pool.
The accounting policies of these reportable segments are the same as
those disclosed in Note 1 to the Consolidated Financial Statements.
The prior-period balances reflect reclassifications to conform the
presentation in those periods to the current period’s presentation.
Reclassifications during the first quarter of 2012 related to the transfer of
the substantial majority of the Company’s retail partner cards business
(which Citi now refers to as “Citi retail services”) from Citi Holdings—Local
Consumer Lending to Citicorp—North America Regional Consumer
Banking. Additionally, certain consolidated expenses were re-allocated to the
respective businesses receiving the services.
The following table presents certain information regarding the Company’s
continuing operations by segment:
Revenues,
net of interest expense (1)
Provision (benefit)
for income taxes
Income (loss) from
continuing operations (2) Identifiable assets
In millions of dollars, except
identifiable assets in billions 2012 2011 2010 2012 2011 2010 2012 2011 2010 2012 2011
Global Consumer Banking $40,214 $39,195 $39,369 $ 3,733 $ 3,509 $ 1,551 $ 8,104 $ 7,672 $ 4,969 $ 402 $ 385
Institutional Clients Group 30,600 32,002 33,207 2,102 2,820 3,490 7,990 8,262 10,173 1,059 980
Corporate/Other 192 885 1,754 (1,396) (681) 7 (1,625) (728) 242 248 284
Total Citicorp $71,006 $72,082 $74,330 $ 4,439 $ 5,648 $ 5,048 $14,469 $15,206 $15,384 $1,709 $ 1,649
Citi Holdings (833) 6,271 12,271 (4,412) (2,127 ) (2,815) (6,560) (4,103) (4,433) 156 225
Total $70,173 $78,353 $86,601 $ 27 $ 3,521 $ 2,233 $ 7,909 $11,103 $10,951 $ 1,865 $ 1,874
(1) Includes Citicorp (excluding Corporate/Other) total revenues, net of interest expense, in North America of $29.8 billion, $30.1 billion and $33.6 billion; in EMEA of $11.5 billion, $12.3 billion and $11.8 billion; in Latin
America of $14.5 billion, $13.6 billion and $12.8 billion; and in Asia of $15.0 billion, $15.2 billion and $14.4 billion in 2012, 2011 and 2010, respectively. Regional numbers exclude Citi Holdings and Corporate/Other,
which largely operate within the U.S.
(2) Includes pretax provisions (credits) for credit losses and for benefits and claims in the GCB results of $6.6 billion, $6.6 billion and $14.0 billion; in the ICG results of $276 million, $152 million and $(82) million; and in
the Citi Holdings results of $4.9 billion, $6.0 billion and $12.1 billion for 2012, 2011 and 2010, respectively.