Citibank 2012 Annual Report Download - page 166
Download and view the complete annual report
Please find page 166 of the 2012 Citibank annual report below. You can navigate through the pages in the report by either clicking on the pages listed below, or by using the keyword search tool below to find specific information within the annual report.-
 1
1 -
 2
2 -
 3
3 -
 4
4 -
 5
5 -
 6
6 -
 7
7 -
 8
8 -
 9
9 -
 10
10 -
 11
11 -
 12
12 -
 13
13 -
 14
14 -
 15
15 -
 16
16 -
 17
17 -
 18
18 -
 19
19 -
 20
20 -
 21
21 -
 22
22 -
 23
23 -
 24
24 -
 25
25 -
 26
26 -
 27
27 -
 28
28 -
 29
29 -
 30
30 -
 31
31 -
 32
32 -
 33
33 -
 34
34 -
 35
35 -
 36
36 -
 37
37 -
 38
38 -
 39
39 -
 40
40 -
 41
41 -
 42
42 -
 43
43 -
 44
44 -
 45
45 -
 46
46 -
 47
47 -
 48
48 -
 49
49 -
 50
50 -
 51
51 -
 52
52 -
 53
53 -
 54
54 -
 55
55 -
 56
56 -
 57
57 -
 58
58 -
 59
59 -
 60
60 -
 61
61 -
 62
62 -
 63
63 -
 64
64 -
 65
65 -
 66
66 -
 67
67 -
 68
68 -
 69
69 -
 70
70 -
 71
71 -
 72
72 -
 73
73 -
 74
74 -
 75
75 -
 76
76 -
 77
77 -
 78
78 -
 79
79 -
 80
80 -
 81
81 -
 82
82 -
 83
83 -
 84
84 -
 85
85 -
 86
86 -
 87
87 -
 88
88 -
 89
89 -
 90
90 -
 91
91 -
 92
92 -
 93
93 -
 94
94 -
 95
95 -
 96
96 -
 97
97 -
 98
98 -
 99
99 -
 100
100 -
 101
101 -
 102
102 -
 103
103 -
 104
104 -
 105
105 -
 106
106 -
 107
107 -
 108
108 -
 109
109 -
 110
110 -
 111
111 -
 112
112 -
 113
113 -
 114
114 -
 115
115 -
 116
116 -
 117
117 -
 118
118 -
 119
119 -
 120
120 -
 121
121 -
 122
122 -
 123
123 -
 124
124 -
 125
125 -
 126
126 -
 127
127 -
 128
128 -
 129
129 -
 130
130 -
 131
131 -
 132
132 -
 133
133 -
 134
134 -
 135
135 -
 136
136 -
 137
137 -
 138
138 -
 139
139 -
 140
140 -
 141
141 -
 142
142 -
 143
143 -
 144
144 -
 145
145 -
 146
146 -
 147
147 -
 148
148 -
 149
149 -
 150
150 -
 151
151 -
 152
152 -
 153
153 -
 154
154 -
 155
155 -
 156
156 -
 157
157 -
 158
158 -
 159
159 -
 160
160 -
 161
161 -
 162
162 -
 163
163 -
 164
164 -
 165
165 -
 166
166 -
 167
167 -
 168
168 -
 169
169 -
 170
170 -
 171
171 -
 172
172 -
 173
173 -
 174
174 -
 175
175 -
 176
176 -
 177
177 -
 178
178 -
 179
179 -
 180
180 -
 181
181 -
 182
182 -
 183
183 -
 184
184 -
 185
185 -
 186
186 -
 187
187 -
 188
188 -
 189
189 -
 190
190 -
 191
191 -
 192
192 -
 193
193 -
 194
194 -
 195
195 -
 196
196 -
 197
197 -
 198
198 -
 199
199 -
 200
200 -
 201
201 -
 202
202 -
 203
203 -
 204
204 -
 205
205 -
 206
206 -
 207
207 -
 208
208 -
 209
209 -
 210
210 -
 211
211 -
 212
212 -
 213
213 -
 214
214 -
 215
215 -
 216
216 -
 217
217 -
 218
218 -
 219
219 -
 220
220 -
 221
221 -
 222
222 -
 223
223 -
 224
224 -
 225
225 -
 226
226 -
 227
227 -
 228
228 -
 229
229 -
 230
230 -
 231
231 -
 232
232 -
 233
233 -
 234
234 -
 235
235 -
 236
236 -
 237
237 -
 238
238 -
 239
239 -
 240
240 -
 241
241 -
 242
242 -
 243
243 -
 244
244 -
 245
245 -
 246
246 -
 247
247 -
 248
248 -
 249
249 -
 250
250 -
 251
251 -
 252
252 -
 253
253 -
 254
254 -
 255
255 -
 256
256 -
 257
257 -
 258
258 -
 259
259 -
 260
260 -
 261
261 -
 262
262 -
 263
263 -
 264
264 -
 265
265 -
 266
266 -
 267
267 -
 268
268 -
 269
269 -
 270
270 -
 271
271 -
 272
272 -
 273
273 -
 274
274 -
 275
275 -
 276
276 -
 277
277 -
 278
278 -
 279
279 -
 280
280 -
 281
281 -
 282
282 -
 283
283 -
 284
284 -
 285
285 -
 286
286 -
 287
287 -
 288
288 -
 289
289 -
 290
290 -
 291
291 -
 292
292 -
 293
293 -
 294
294 -
 295
295 -
 296
296 -
 297
297 -
 298
298 -
 299
299 -
 300
300 -
 301
301 -
 302
302 -
 303
303 -
 304
304 -
 305
305 -
 306
306 -
 307
307 -
 308
308 -
 309
309 -
 310
310 -
 311
311 -
 312
312 -
 313
313 -
 314
314 -
 315
315 -
 316
316 -
 317
317 -
 318
318 -
 319
319 -
 320
320 -
 321
321 -
 322
322 -
 323
323 -
 324
324
 |
 |
144
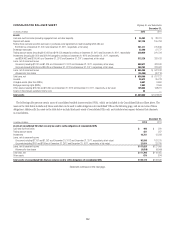
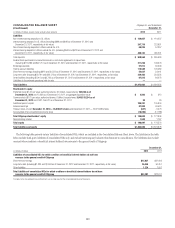
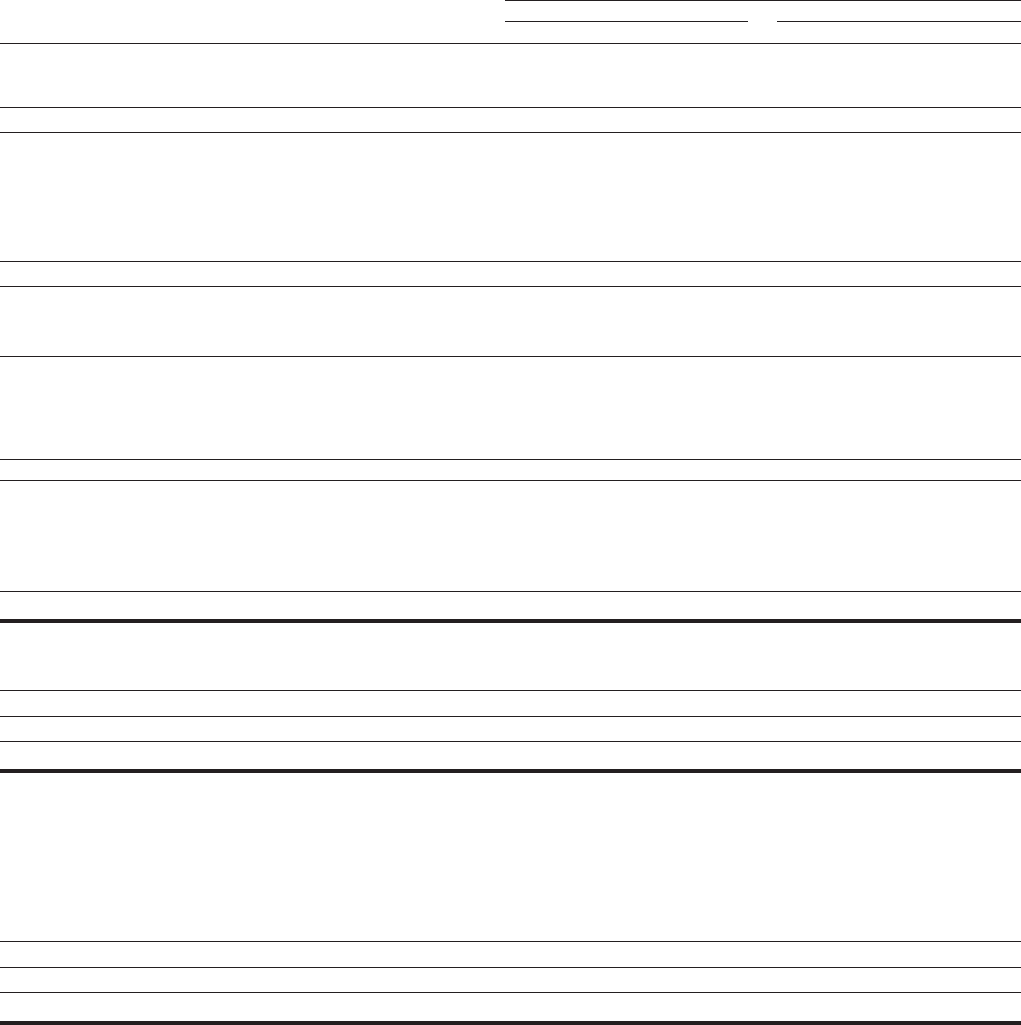
CONSOLIDATED STATEMENT OF CHANGES IN STOCKHOLDERS’ EQUITY Citigroup Inc. and Subsidiaries
Years ended December 31,
Amounts Shares
In millions of dollars, except shares in thousands 2012 2011 2010 2012 2011 2010
Preferred stock at aggregate liquidation value
Balance, beginning of year $ 312 $ 312 $ 312 12 12 12
Issuance of new preferred stock 2,250 — — 90 — —
Balance, end of period $ 2,562 $ 312 $ 312 102 12 12
Common stock and additional paid-in capital
Balance, beginning of year $105,833 $101,316 $ 98,428 2,937,756 2,922,402 2,862,610
Employee benefit plans 597 766 (736) 9,037 3,540 46,703
Issuance of shares and T-DECs for TARP repayment —— — 96,338 — 1,270
ADIA Upper DECs equity units purchase contract —3,750 3,750 —11,781 11,781
Other (9) 1 (126) 22 33 38
Balance, end of period $106,421 $105,833 $101,316 3,043,153 2,937,756 2,922,402
Retained earnings
Balance, beginning of year $ 90,520 $ 79,559 $ 77,440
Adjustment to opening balance, net of taxes (1)(2) (107) — (8,483)
Adjusted balance, beginning of period $ 90,413 $ 79,559 $ 68,957
Citigroup’s net income 7,541 11,067 10,602
Common dividends (3) (120) (81) 10
Preferred dividends (26) (26) (9)
Other 11 (1)
Balance, end of period $ 97,809 $ 90,520 $ 79,559
Treasury stock, at cost
Balance, beginning of year $ (1,071) $ (1,442) $ (4,543) (13,878) (16,566) (14,283)
Issuance of shares pursuant to employee benefit plans 229 372 3,106 (253) 2,714 (2,128)
Treasury stock acquired (4) (5) (1) (6) (138) (26) (162)
Other —— 1 —— 7
Balance, end of period $ (847) $ (1,071) $ (1,442) (14,269) (13,878) (16,566)
Citigroup’s accumulated other comprehensive income (loss)
Balance, beginning of year $ (17,788) $ (16,277) $ (18,937)
Net change in Citigroup’s Accumulated other comprehensive income (loss) 892 (1,511) 2,660
Balance, end of period $ (16,896) $ (17,788) $ (16,277)
Total Citigroup common stockholders’ equity $186,487 $177,494 $163,156 3,028,884 2,923,878 2,905,836
Total Citigroup stockholders’ equity $189,049 $177,806 $163,468
Noncontrolling interest
Balance, beginning of year $ 1,767 $ 2,321 $ 2,273
Initial origination of a noncontrolling interest 88 28 412
Transactions between Citigroup and the noncontrolling-interest shareholders 41 (274) (231)
Net income attributable to noncontrolling-interest shareholders 219 148 281
Dividends paid to noncontrolling-interest shareholders (33) (67) (99)
Net change in Accumulated other comprehensive income (loss) 90 (92) (26)
Other (224) (297) (289)
Net change in noncontrolling interests $ 181 $ (554) $ 48
Balance, end of period $ 1,948 $ 1,767 $ 2,321
Total equity $190,997 $179,573 $165,789
(1) The adjustment to the opening balance for Retained earnings in 2012 represents the cumulative effect of adopting ASU 2010-26, Financial Services—Insurance (Topic 944): Accounting for Costs Associated with
Acquiring or Renewing Insurance Contracts. See Note 1 to the Consolidated Financial Statements.
(2) The adjustment to the opening balance for Retained earnings in 2010 represents the cumulative effect of initially adopting ASC 810, Consolidation (SFAS 167) and ASU 2010-11 (Scope Exception Related to Embedded
Credit Derivatives). See Note 1 to the Consolidated Financial Statements.
(3) Common dividends declared were $0.01 per share in each of the first, second, third and fourth quarters of 2012, and second, third and fourth quarters of 2011. Common dividends in 2010 represent a reversal of
dividends accrued on forfeitures of previously issued but unvested employee stock awards related to employees who have left Citigroup.
(4) All open market repurchases were transacted under an existing authorized share repurchase plan and relate to customer fails/errors.
The Notes to the Consolidated Financial Statements are an integral part of these Consolidated Financial Statements.
