Citibank 2012 Annual Report Download - page 274
Download and view the complete annual report
Please find page 274 of the 2012 Citibank annual report below. You can navigate through the pages in the report by either clicking on the pages listed below, or by using the keyword search tool below to find specific information within the annual report.-
 1
1 -
2
-
3
-
4
-
5
-
6
-
7
-
8
-
9
-
10
-
11
-
12
-
13
-
14
-
15
-
16
-
17
-
18
-
19
-
20
-
21
-
22
-
23
-
24
-
25
-
26
-
27
-
28
-
29
-
30
-
31
-
32
-
33
-
34
-
35
-
36
-
37
-
38
-
39
-
40
-
41
-
42
-
43
-
44
-
45
-
46
-
47
-
48
-
49
-
50
-
51
-
52
-
53
-
54
-
55
-
56
-
57
-
58
-
59
-
60
-
61
-
62
-
63
-
64
-
65
-
66
-
67
-
68
-
69
-
70
-
71
-
72
-
73
-
74
-
75
-
76
-
77
-
78
-
79
-
80
-
81
-
82
-
83
-
84
-
85
-
86
-
87
-
88
-
89
-
90
-
91
-
92
-
93
-
94
-
95
-
96
-
97
-
98
-
99
-
100
-
101
-
102
-
103
-
104
-
105
-
106
-
107
-
108
-
109
-
110
-
111
-
112
-
113
-
114
-
115
-
116
-
117
-
118
-
119
-
120
-
121
-
122
-
123
-
124
-
125
-
126
-
127
-
128
-
129
-
130
-
131
-
132
-
133
-
134
-
135
-
136
-
137
-
138
-
139
-
140
-
141
-
142
-
143
-
144
-
145
-
146
-
147
-
148
-
149
-
150
-
151
-
152
-
153
-
154
-
155
-
156
-
157
-
158
-
159
-
160
-
161
-
162
-
163
-
164
-
165
-
166
-
167
-
168
-
169
-
170
-
171
-
172
-
173
-
174
-
175
-
176
-
177
-
178
-
179
-
180
-
181
-
182
-
183
-
184
-
185
-
186
-
187
-
188
-
189
-
190
-
191
-
192
-
193
-
194
-
195
-
196
-
197
-
198
-
199
-
200
-
201
-
202
-
203
-
204
-
205
-
206
-
207
-
208
-
209
-
210
-
211
-
212
-
213
-
214
-
215
-
216
-
217
-
218
-
219
-
220
-
221
-
222
-
223
-
224
-
225
-
226
-
227
-
228
-
229
-
230
-
231
-
232
-
233
-
234
-
235
-
236
-
237
-
238
-
239
-
240
-
241
-
242
-
243
-
244
-
245
-
246
-
247
-
248
-
249
-
250
-
251
-
252
-
253
-
254
-
255
-
256
-
257
-
258
-
259
-
260
-
261
-
262
-
263
-
 264
264 -
 265
265 -
 266
266 -
 267
267 -
 268
268 -
 269
269 -
 270
270 -
 271
271 -
 272
272 -
 273
273 -
 274
274 -
 275
275 -
 276
276 -
 277
277 -
 278
278 -
 279
279 -
 280
280 -
 281
281 -
 282
282 -
 283
283 -
 284
284 -
285
-
286
-
287
-
288
-
289
-
290
-
291
-
292
-
293
-
294
-
295
-
296
-
297
-
298
-
299
-
300
-
301
-
302
-
303
-
304
-
305
-
306
-
307
-
308
-
309
-
310
-
311
-
312
-
313
-
314
-
315
-
316
-
317
-
318
-
319
-
320
-
321
-
322
-
323
-
324
 |
 |
252
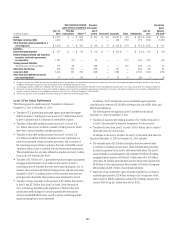
ReportsofinventorythatisclassifiedwithinLevel3ofthefairvalue
hierarchy are distributed to senior management in Finance, Risk and the
individual business. This inventory is also discussed in Risk Committees and
in monthly meetings with senior trading management. As deemed necessary,
reports may go to the Audit Committee of the Board of Directors or to the
full Board of Directors. Whenever a valuation adjustment is needed to bring
the price of an asset or liability to its exit price, Product Control reports it to
management along with other price verification results.
In addition, the pricing models used in measuring fair value are governed
by an independent control framework. Although the models are developed
and tested by the individual business units, they are independently validated
bytheModelValidationGroupwithinRiskManagementandreviewedby
Finance with respect to their impact on the price verification procedures. The
purpose of this independent control framework is to assess model risk arising
from models’ theoretical soundness, calibration techniques where needed,
and the appropriateness of the model for a specific product in a defined
market.Valuationadjustments,ifany,gothroughasimilarindependent
review process as the valuation models. To ensure their continued
applicability, models are independently reviewed annually. In addition,
Risk Management approves and maintains a list of products permitted to be
valued under each approved model for a given business.
Securities purchased under agreements to resell and
securities sold under agreements to repurchase
No quoted prices exist for such instruments, so fair value is determined using
a discounted cash-flow technique. Cash flows are estimated based on the
terms of the contract, taking into account any embedded derivative or other
features. Expected cash flows are discounted using interest rates appropriate
to the maturity of the instrument as well as the nature of the underlying
collateral. Generally, when such instruments are held at fair value, they are
classifiedwithinLevel2ofthefairvaluehierarchy,astheinputsusedinthe
valuation are readily observable. However, certain long-dated positions are
classifiedwithinLevel3ofthefairvaluehierarchy.
Trading account assets and liabilities—trading securities
and trading loans
When available, the Company uses quoted market prices to determine the
fairvalueoftradingsecurities;suchitemsareclassifiedasLevel1ofthe
fair value hierarchy. Examples include some government securities and
exchange-traded equity securities.
For bonds and secondary market loans traded over the counter, the
Company generally determines fair value utilizing valuation techniques,
including discounted cash flows, price-based and internal models, such
as Black-Scholes and Monte Carlo simulation. Fair value estimates from
these internal valuation techniques are verified, where possible, to prices
obtainedfromindependentvendors.Vendorscompilepricesfromvarious
sources and may apply matrix pricing for similar bonds or loans where no
price is observable. A price-based methodology utilizes, where available,
quoted prices or other market information obtained from recent trading
activity of assets with similar characteristics to the bond or loan being valued.
The yields used in discounted cash flow models are derived from the same
price information. Trading securities and loans priced using such methods
aregenerallyclassifiedasLevel2.However,whenlessliquidityexistsfora
security or loan, a quoted price is stale, a significant adjustment to the price
of a similar security or loan is necessary to reflect differences in the terms of
the actual security or loan being valued, or prices from independent sources
are insufficient to corroborate valuation, a loan or security is generally
classifiedasLevel3.Thepriceinputusedinaprice-basedmethodologymay
be zero for a security, such as a subprime CDO, that is not receiving any
principal or interest and is currently written down to zero.
Where the Company’s principal market for a portfolio of loans is the
securitization market, the Company uses the securitization price to determine
the fair value of the portfolio. The securitization price is determined from
the assumed proceeds of a hypothetical securitization in the current market,
adjusted for transformation costs (i.e., direct costs other than transaction
costs) and securitization uncertainties such as market conditions and
liquidity. As a result of the severe reduction in the level of activity in
certain securitization markets since the second half of 2007, observable
securitization prices for certain directly comparable portfolios of loans
have not been readily available. Therefore, such portfolios of loans are
generallyclassifiedasLevel3ofthefairvaluehierarchy.However,forother
loan securitization markets, such as commercial real estate loans, pricing
verification of the hypothetical securitizations has been possible, since these
markets have remained active. Accordingly, this loan portfolio is classified as
Level2ofthefairvaluehierarchy.
Trading account assets and liabilities—derivatives
Exchange-traded derivatives are generally measured at fair value using
quotedmarket(i.e.,exchange)pricesandareclassifiedasLevel1ofthefair
value hierarchy.
The majority of derivatives entered into by the Company are executed over
the counter and are valued using internal valuation techniques, as no quoted
market prices exist for such instruments. The valuation techniques and inputs
depend on the type of derivative and the nature of the underlying instrument.
The principal techniques used to value these instruments are discounted
cash flows and internal models, including Black-Scholes and Monte Carlo
simulation. The fair values of derivative contracts reflect cash the Company has
paid or received (for example, option premiums paid and received).
The key inputs depend upon the type of derivative and the nature of
the underlying instrument and include interest rate yield curves, foreign-
exchange rates, volatilities and correlation. The Company uses overnight
indexed swap (OIS) curves as fair value measurement inputs for the
valuation of certain collateralized interest-rate related derivatives. The
instrumentisclassifiedaseitherLevel2orLevel3dependinguponthe
observability of the significant inputs to the model.