Citibank 2012 Annual Report Download - page 201
Download and view the complete annual report
Please find page 201 of the 2012 Citibank annual report below. You can navigate through the pages in the report by either clicking on the pages listed below, or by using the keyword search tool below to find specific information within the annual report.-
 1
1 -
2
-
3
-
4
-
5
-
6
-
7
-
8
-
9
-
10
-
11
-
12
-
13
-
14
-
15
-
16
-
17
-
18
-
19
-
20
-
21
-
22
-
23
-
24
-
25
-
26
-
27
-
28
-
29
-
30
-
31
-
32
-
33
-
34
-
35
-
36
-
37
-
38
-
39
-
40
-
41
-
42
-
43
-
44
-
45
-
46
-
47
-
48
-
49
-
50
-
51
-
52
-
53
-
54
-
55
-
56
-
57
-
58
-
59
-
60
-
61
-
62
-
63
-
64
-
65
-
66
-
67
-
68
-
69
-
70
-
71
-
72
-
73
-
74
-
75
-
76
-
77
-
78
-
79
-
80
-
81
-
82
-
83
-
84
-
85
-
86
-
87
-
88
-
89
-
90
-
91
-
92
-
93
-
94
-
95
-
96
-
97
-
98
-
99
-
100
-
101
-
102
-
103
-
104
-
105
-
106
-
107
-
108
-
109
-
110
-
111
-
112
-
113
-
114
-
115
-
116
-
117
-
118
-
119
-
120
-
121
-
122
-
123
-
124
-
125
-
126
-
127
-
128
-
129
-
130
-
131
-
132
-
133
-
134
-
135
-
136
-
137
-
138
-
139
-
140
-
141
-
142
-
143
-
144
-
145
-
146
-
147
-
148
-
149
-
150
-
151
-
152
-
153
-
154
-
155
-
156
-
157
-
158
-
159
-
160
-
161
-
162
-
163
-
164
-
165
-
166
-
167
-
168
-
169
-
170
-
171
-
172
-
173
-
174
-
175
-
176
-
177
-
178
-
179
-
180
-
181
-
182
-
183
-
184
-
185
-
186
-
187
-
188
-
189
-
190
-
 191
191 -
 192
192 -
 193
193 -
 194
194 -
 195
195 -
 196
196 -
 197
197 -
 198
198 -
 199
199 -
 200
200 -
 201
201 -
 202
202 -
 203
203 -
 204
204 -
 205
205 -
 206
206 -
 207
207 -
 208
208 -
 209
209 -
 210
210 -
 211
211 -
212
-
213
-
214
-
215
-
216
-
217
-
218
-
219
-
220
-
221
-
222
-
223
-
224
-
225
-
226
-
227
-
228
-
229
-
230
-
231
-
232
-
233
-
234
-
235
-
236
-
237
-
238
-
239
-
240
-
241
-
242
-
243
-
244
-
245
-
246
-
247
-
248
-
249
-
250
-
251
-
252
-
253
-
254
-
255
-
256
-
257
-
258
-
259
-
260
-
261
-
262
-
263
-
264
-
265
-
266
-
267
-
268
-
269
-
270
-
271
-
272
-
273
-
274
-
275
-
276
-
277
-
278
-
279
-
280
-
281
-
282
-
283
-
284
-
285
-
286
-
287
-
288
-
289
-
290
-
291
-
292
-
293
-
294
-
295
-
296
-
297
-
298
-
299
-
300
-
301
-
302
-
303
-
304
-
305
-
306
-
307
-
308
-
309
-
310
-
311
-
312
-
313
-
314
-
315
-
316
-
317
-
318
-
319
-
320
-
321
-
322
-
323
-
324
 |
 |

179
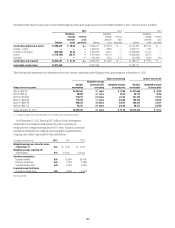
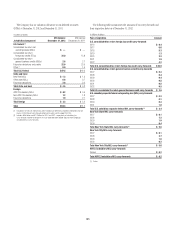
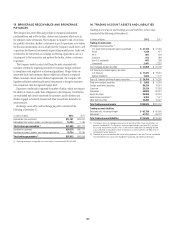
In millions of dollars Non-U.S. pension and postretirement benefit plans
Fair value measurement at December 31, 2012
Asset categories Level 1 Level 2 Level 3 Total
Equity securities
U.S. equity $ 12 $ 12 $ — $ 24
Non-U.S. equity 88 77 48 213
Mutual funds 31 4,583 — 4,614
Commingled funds 26 — — 26
Debt securities
U.S. Treasuries — 1 — 1
U.S. corporate bonds 10 478 — 488
Non-U.S. government debt 1,806 144 4 1,954
Non-U.S. corporate bonds 162 804 4 970
State and municipal debt — — — —
Hedge funds — — 16 16
Mortgage-backed securities — 1 — 1
Annuity contracts — 5 6 11
Derivatives — 40 — 40
Other investments 3 9 219 231
Total investments at fair value $2,138 $6,154 $297 $8,589
Cash and short-term investments $ 56 $ 4 $ 3 $ 63
Total assets $2,194 $6,158 $300 $8,652
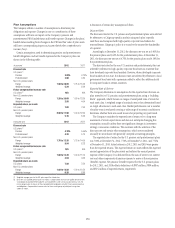
In millions of dollars Non-U.S. pension and postretirement benefit plans
Fair value measurement at December 31, 2011
Asset categories Level 1 Level 2 Level 3 Total
Equity securities
U.S. equity $ 12 $ — $ — $ 12
Non-U.S. equity 48 180 5 233
Mutual funds 11 4,439 32 4,482
Commingled funds 26 — — 26
Debt securities
U.S. Treasuries 1 — — 1
U.S. corporate bonds 1 379 — 380
Non-U.S. government debt 1,484 129 5 1,618
Non-U.S. corporate bonds 5 318 3 326
State and municipal debt — — — —
Hedge funds — 3 12 15
Mortgage-backed securities 1 — — 1
Annuity contracts — 3 — 3
Derivatives — 3 — 3
Other investments 3 6 240 249
Total investments at fair value $1,592 $5,460 $297 $7,349
Cash and short-term investments $ 168 $ — $ — $ 168
Total assets $1,760 $5,460 $297 $7,517