Citibank 2012 Annual Report Download - page 30
Download and view the complete annual report
Please find page 30 of the 2012 Citibank annual report below. You can navigate through the pages in the report by either clicking on the pages listed below, or by using the keyword search tool below to find specific information within the annual report.-
 1
1 -
2
-
3
-
4
-
5
-
6
-
7
-
8
-
9
-
10
-
11
-
12
-
13
-
14
-
15
-
16
-
17
-
18
-
19
-
 20
20 -
 21
21 -
 22
22 -
 23
23 -
 24
24 -
 25
25 -
 26
26 -
 27
27 -
 28
28 -
 29
29 -
 30
30 -
 31
31 -
 32
32 -
 33
33 -
 34
34 -
 35
35 -
 36
36 -
 37
37 -
 38
38 -
 39
39 -
 40
40 -
41
-
42
-
43
-
44
-
45
-
46
-
47
-
48
-
49
-
50
-
51
-
52
-
53
-
54
-
55
-
56
-
57
-
58
-
59
-
60
-
61
-
62
-
63
-
64
-
65
-
66
-
67
-
68
-
69
-
70
-
71
-
72
-
73
-
74
-
75
-
76
-
77
-
78
-
79
-
80
-
81
-
82
-
83
-
84
-
85
-
86
-
87
-
88
-
89
-
90
-
91
-
92
-
93
-
94
-
95
-
96
-
97
-
98
-
99
-
100
-
101
-
102
-
103
-
104
-
105
-
106
-
107
-
108
-
109
-
110
-
111
-
112
-
113
-
114
-
115
-
116
-
117
-
118
-
119
-
120
-
121
-
122
-
123
-
124
-
125
-
126
-
127
-
128
-
129
-
130
-
131
-
132
-
133
-
134
-
135
-
136
-
137
-
138
-
139
-
140
-
141
-
142
-
143
-
144
-
145
-
146
-
147
-
148
-
149
-
150
-
151
-
152
-
153
-
154
-
155
-
156
-
157
-
158
-
159
-
160
-
161
-
162
-
163
-
164
-
165
-
166
-
167
-
168
-
169
-
170
-
171
-
172
-
173
-
174
-
175
-
176
-
177
-
178
-
179
-
180
-
181
-
182
-
183
-
184
-
185
-
186
-
187
-
188
-
189
-
190
-
191
-
192
-
193
-
194
-
195
-
196
-
197
-
198
-
199
-
200
-
201
-
202
-
203
-
204
-
205
-
206
-
207
-
208
-
209
-
210
-
211
-
212
-
213
-
214
-
215
-
216
-
217
-
218
-
219
-
220
-
221
-
222
-
223
-
224
-
225
-
226
-
227
-
228
-
229
-
230
-
231
-
232
-
233
-
234
-
235
-
236
-
237
-
238
-
239
-
240
-
241
-
242
-
243
-
244
-
245
-
246
-
247
-
248
-
249
-
250
-
251
-
252
-
253
-
254
-
255
-
256
-
257
-
258
-
259
-
260
-
261
-
262
-
263
-
264
-
265
-
266
-
267
-
268
-
269
-
270
-
271
-
272
-
273
-
274
-
275
-
276
-
277
-
278
-
279
-
280
-
281
-
282
-
283
-
284
-
285
-
286
-
287
-
288
-
289
-
290
-
291
-
292
-
293
-
294
-
295
-
296
-
297
-
298
-
299
-
300
-
301
-
302
-
303
-
304
-
305
-
306
-
307
-
308
-
309
-
310
-
311
-
312
-
313
-
314
-
315
-
316
-
317
-
318
-
319
-
320
-
321
-
322
-
323
-
324
 |
 |

8
Credit Costs
Citi’s total provisions for credit losses and for benefits and claims
of $11.7 billion declined 8% from the prior year. Net credit losses of
$14.6 billion were down 27% from 2011, largely reflecting improvements
in North America cards and Local Consumer Lending and the Special
Asset Pool within Citi Holdings. Consumer net credit losses declined 22% to
$14.4 billion reflecting improvements in North America Citi-branded cards
and Citi retail services in Citicorp and Local Consumer Lending within
Citi Holdings. Corporate net credit losses decreased 86% year-over-year to
$223 million, driven primarily by continued credit improvement in both the
Special Asset Pool in Citi Holdings and Securities and Banking in Citicorp.
The net release of allowance for loan losses and unfunded lending
commitments was $3.7 billion in 2012, 55% lower than 2011. Of the
$3.7 billion net reserve release, $2.1 billion was attributable to Citicorp
compared to a $4.9 billion release in the prior year. The decline in the
Citicorp reserve release year-over-year mostly reflected a lower reserve release
in North America Citi-branded cards and Citi retail services and Securities
and Banking. The $1.6 billion net reserve release in Citi Holdings was down
from $3.3 billion in the prior year, due primarily to lower releases within
the Special Asset Pool, reflecting the decline in assets. Of the $3.7 billion
net reserve release, $3.6 billion related to Consumer, with the remainder
in Corporate.
Capital and Loan Loss Reserve Positions
Citigroup’s Tier 1 Capital and Tier 1 Common ratios were 14.1% and
12.7% as of December 31, 2012, respectively, compared to 13.6% and 11.8%
in the prior year. Citi’s estimated Tier 1 Common ratio under Basel III
was 8.7% at December 31, 2012, up slightly from an estimated 8.6% at
September 30, 2012.4
Citigroup’s total allowance for loan losses was $25.5 billion at year end, or
3.9% of total loans, compared to $30.1 billion, or 4.7%, at the end of the prior
year. The decline in the total allowance for loan losses reflected the continued
wind-down of Citi Holdings and overall continued improvement in the credit
quality of Citi’s loan portfolios.
The Consumer allowance for loan losses was $22.7 billion, or 5.6% of
total Consumer loans, at year end, compared to $27.2 billion, or 6.5% of
total loans, at December 31, 2011. Total non-accrual assets increased 3%
to $12.0 billion as compared to December 31, 2011. Corporate non-accrual
loans declined 28% to $2.3 billion, reflecting continued credit improvement.
Consumer non-accrual loans increased $1.4 billion, or 17%, to $9.2 billion
versus the prior year. The increase in Consumer non-accrual loans
predominantly reflected the Office of the Comptroller of the Currency (OCC)
guidance issued in the third quarter of 2012 regarding the treatment of
mortgage loans where the borrower has gone through Chapter 7 bankruptcy,
which added $1.5 billion to Consumer non-accrual loans (of which
approximately $1.3 billion were current).
4 Citi’s estimated Basel III Tier 1 Common ratio is a non-GAAP financial measure. For additional
information on Citi’s estimated Basel III Tier 1 Common Capital and Tier 1 Common ratio, including the
calculation of these measures, see “Capital Resources and Liquidity—Capital Resources” below.
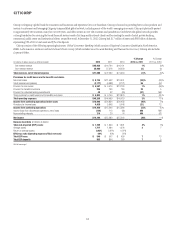
Citicorp5
Citicorp net income decreased 8% from the prior year to $14.1 billion. The
decrease largely reflected the impact of CVA/DVA and higher legal and
related costs and repositioning charges, partially offset by lower provisions
for income taxes. CVA/DVA, recorded in Securities and Banking, was
$(2.5) billion in 2012, compared to $1.7 billion in the prior year. Within
Citicorp, repositioning charges were $951 million ($604 million after-tax) in
the fourth quarter 2012, versus $368 million ($237 million after-tax) in the
prior year period. Excluding CVA/DVA, the impact of minority investments,
the repositioning charges in the fourth quarters of 2012 and 2011, and the
tax benefit in the third quarter of 2012, Citicorp net income increased 9%
from the prior year to $15.6 billion, primarily driven by growth in revenues
and lower net credit losses partially offset by lower loan loss reserve releases
and higher taxes.
Citicorp revenues, net of interest expense, were $71 billion in 2012, down
1% versus the prior year. Excluding CVA/DVA and the impact of minority
investments, Citicorp revenues were $73.4 billion in 2012, 5% higher
than 2011. Global Consumer Banking (GCB) revenues of $40.2 billion
increased 3% versus the prior year. North America RCB revenues grew
5% to $21.1 billion. International RCB revenues (consisting of Asia RCB,
Latin America RCB and EMEA RCB) increased 1% year-over-year to
$19.1 billion. Excluding the impact of FX translation,6 international RCB
revenues increased 5% year-over-year. Securities and Banking revenues
were $19.7 billion in 2012, down 8% year-over-year. Securities and Banking
revenues, excluding CVA/DVA, were $22.2 billion, or 13%, higher than the
prior year. Transaction Services revenues were $10.9 billion, up 3% from
the prior year, but up 5% excluding the impact of FX translation. Corporate/
Other revenues, excluding the impact of minority investments, declined 80%
from the prior year mainly reflecting the absence of hedging gains.
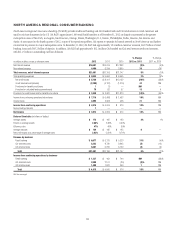
In North America RCB, the revenue growth year-over-year was driven by
higher mortgage revenues, partially offset by lower revenues in Citi-branded
cards and Citi retail services, mostly driven by lower average card loans.
North America RCB average deposits of $154 billion grew 6% year-over-year
and average retail loans of $41 billion grew 19%. Average card loans of
$109 billion declined 3%, driven by increased payment rates resulting from
consumer deleveraging, and card purchase sales of $232 billion were roughly
flat. Citi retail services revenues were also negatively impacted by improving
credit trends, which increased contractual partner payments.
5 Citicorp includes Citi’s three operating businesses—Global Consumer Banking, Securities and
Banking and Transaction Services—as well as Corporate/Other. See “Citicorp” below for additional
information on the results of operations for each of the businesses in Citicorp.
6 For the impact of FX translation on 2012 results of operations for each of EMEA RCB, Latin America
RCB, Asia RCB and Transaction Services, see the table accompanying the discussion of each
respective business’ results of operations below.