Citibank 2012 Annual Report Download - page 242
Download and view the complete annual report
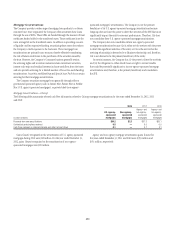
Please find page 242 of the 2012 Citibank annual report below. You can navigate through the pages in the report by either clicking on the pages listed below, or by using the keyword search tool below to find specific information within the annual report.-
 1
1 -
2
-
3
-
4
-
5
-
6
-
7
-
8
-
9
-
10
-
11
-
12
-
13
-
14
-
15
-
16
-
17
-
18
-
19
-
20
-
21
-
22
-
23
-
24
-
25
-
26
-
27
-
28
-
29
-
30
-
31
-
32
-
33
-
34
-
35
-
36
-
37
-
38
-
39
-
40
-
41
-
42
-
43
-
44
-
45
-
46
-
47
-
48
-
49
-
50
-
51
-
52
-
53
-
54
-
55
-
56
-
57
-
58
-
59
-
60
-
61
-
62
-
63
-
64
-
65
-
66
-
67
-
68
-
69
-
70
-
71
-
72
-
73
-
74
-
75
-
76
-
77
-
78
-
79
-
80
-
81
-
82
-
83
-
84
-
85
-
86
-
87
-
88
-
89
-
90
-
91
-
92
-
93
-
94
-
95
-
96
-
97
-
98
-
99
-
100
-
101
-
102
-
103
-
104
-
105
-
106
-
107
-
108
-
109
-
110
-
111
-
112
-
113
-
114
-
115
-
116
-
117
-
118
-
119
-
120
-
121
-
122
-
123
-
124
-
125
-
126
-
127
-
128
-
129
-
130
-
131
-
132
-
133
-
134
-
135
-
136
-
137
-
138
-
139
-
140
-
141
-
142
-
143
-
144
-
145
-
146
-
147
-
148
-
149
-
150
-
151
-
152
-
153
-
154
-
155
-
156
-
157
-
158
-
159
-
160
-
161
-
162
-
163
-
164
-
165
-
166
-
167
-
168
-
169
-
170
-
171
-
172
-
173
-
174
-
175
-
176
-
177
-
178
-
179
-
180
-
181
-
182
-
183
-
184
-
185
-
186
-
187
-
188
-
189
-
190
-
191
-
192
-
193
-
194
-
195
-
196
-
197
-
198
-
199
-
200
-
201
-
202
-
203
-
204
-
205
-
206
-
207
-
208
-
209
-
210
-
211
-
212
-
213
-
214
-
215
-
216
-
217
-
218
-
219
-
220
-
221
-
222
-
223
-
224
-
225
-
226
-
227
-
228
-
229
-
230
-
231
-
 232
232 -
 233
233 -
 234
234 -
 235
235 -
 236
236 -
 237
237 -
 238
238 -
 239
239 -
 240
240 -
 241
241 -
 242
242 -
 243
243 -
 244
244 -
 245
245 -
 246
246 -
 247
247 -
 248
248 -
 249
249 -
 250
250 -
 251
251 -
 252
252 -
253
-
254
-
255
-
256
-
257
-
258
-
259
-
260
-
261
-
262
-
263
-
264
-
265
-
266
-
267
-
268
-
269
-
270
-
271
-
272
-
273
-
274
-
275
-
276
-
277
-
278
-
279
-
280
-
281
-
282
-
283
-
284
-
285
-
286
-
287
-
288
-
289
-
290
-
291
-
292
-
293
-
294
-
295
-
296
-
297
-
298
-
299
-
300
-
301
-
302
-
303
-
304
-
305
-
306
-
307
-
308
-
309
-
310
-
311
-
312
-
313
-
314
-
315
-
316
-
317
-
318
-
319
-
320
-
321
-
322
-
323
-
324
 |
 |

220
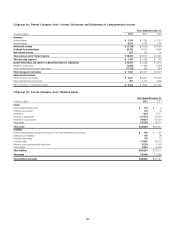
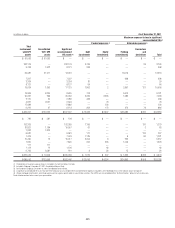
Citigroup Inc. Parent Company Only(1) Income Statement and Statement of Comprehensive Income
Years Ended December 31,
In millions of dollars 2012 2011 2010
Revenues
Interest revenue $ 3,384 $ 3,684 $ 3,237
Interest expense 6,573 7,618 7,728
Net interest revenue $ (3,189) $ (3,934) $ (4,491)
Dividends from subsidiaries 20,780 13,046 14,448
Non-interest revenue 613 939 30
Total revenues, net of interest expense $ 18,204 $10,051 $ 9,987
Total operating expenses $ 1,497 $ 1,503 $ 878
Income before taxes and equity in undistributed income of subsidiaries $ 16,707 $ 8,548 $ 9,109
Benefit for income taxes (2,062) (1,821) (2,480)
Equity in undistributed income of subsidiaries (11,228) 698 (987)
Parent company’s net income $ 7,541 $11,067 $10,602
Comprehensive income
Parent company’s net income $ 7,541 $11,067 $10,602
Other comprehensive income (loss) 892 (1,511) 2,660
Parent company’s comprehensive income $ 8,433 $ 9,556 $13,262
Citigroup Inc. Parent Company Only(1) Balance Sheet
Years Ended December 31,
In millions of dollars 2012 2011
Assets
Cash and deposits from banks $ 153 $ 3
Trading account assets 150 99
Investments 1,676 37,477
Advances to subsidiaries 107,074 108,644
Investments in subsidiaries 184,615 194,979
Other assets 102,335 65,711
Total assets $396,003 $406,913
Liabilities
Federal funds purchased and securities loaned or sold under agreements to repurchase $ 185 $ 185
Trading account liabilities 170 96
Short-term borrowings 725 13
Long-term debt 176,553 181,702
Advances from subsidiaries other than banks 12,759 17,046
Other liabilities 16,562 30,065
Total liabilities $206,954 $229,107
Total equity 189,049 177,806
Total liabilities and equity $396,003 $406,913