Citibank 2012 Annual Report Download - page 276
Download and view the complete annual report
Please find page 276 of the 2012 Citibank annual report below. You can navigate through the pages in the report by either clicking on the pages listed below, or by using the keyword search tool below to find specific information within the annual report.-
 1
1 -
2
-
3
-
4
-
5
-
6
-
7
-
8
-
9
-
10
-
11
-
12
-
13
-
14
-
15
-
16
-
17
-
18
-
19
-
20
-
21
-
22
-
23
-
24
-
25
-
26
-
27
-
28
-
29
-
30
-
31
-
32
-
33
-
34
-
35
-
36
-
37
-
38
-
39
-
40
-
41
-
42
-
43
-
44
-
45
-
46
-
47
-
48
-
49
-
50
-
51
-
52
-
53
-
54
-
55
-
56
-
57
-
58
-
59
-
60
-
61
-
62
-
63
-
64
-
65
-
66
-
67
-
68
-
69
-
70
-
71
-
72
-
73
-
74
-
75
-
76
-
77
-
78
-
79
-
80
-
81
-
82
-
83
-
84
-
85
-
86
-
87
-
88
-
89
-
90
-
91
-
92
-
93
-
94
-
95
-
96
-
97
-
98
-
99
-
100
-
101
-
102
-
103
-
104
-
105
-
106
-
107
-
108
-
109
-
110
-
111
-
112
-
113
-
114
-
115
-
116
-
117
-
118
-
119
-
120
-
121
-
122
-
123
-
124
-
125
-
126
-
127
-
128
-
129
-
130
-
131
-
132
-
133
-
134
-
135
-
136
-
137
-
138
-
139
-
140
-
141
-
142
-
143
-
144
-
145
-
146
-
147
-
148
-
149
-
150
-
151
-
152
-
153
-
154
-
155
-
156
-
157
-
158
-
159
-
160
-
161
-
162
-
163
-
164
-
165
-
166
-
167
-
168
-
169
-
170
-
171
-
172
-
173
-
174
-
175
-
176
-
177
-
178
-
179
-
180
-
181
-
182
-
183
-
184
-
185
-
186
-
187
-
188
-
189
-
190
-
191
-
192
-
193
-
194
-
195
-
196
-
197
-
198
-
199
-
200
-
201
-
202
-
203
-
204
-
205
-
206
-
207
-
208
-
209
-
210
-
211
-
212
-
213
-
214
-
215
-
216
-
217
-
218
-
219
-
220
-
221
-
222
-
223
-
224
-
225
-
226
-
227
-
228
-
229
-
230
-
231
-
232
-
233
-
234
-
235
-
236
-
237
-
238
-
239
-
240
-
241
-
242
-
243
-
244
-
245
-
246
-
247
-
248
-
249
-
250
-
251
-
252
-
253
-
254
-
255
-
256
-
257
-
258
-
259
-
260
-
261
-
262
-
263
-
264
-
265
-
 266
266 -
 267
267 -
 268
268 -
 269
269 -
 270
270 -
 271
271 -
 272
272 -
 273
273 -
 274
274 -
 275
275 -
 276
276 -
 277
277 -
 278
278 -
 279
279 -
 280
280 -
 281
281 -
 282
282 -
 283
283 -
 284
284 -
 285
285 -
 286
286 -
287
-
288
-
289
-
290
-
291
-
292
-
293
-
294
-
295
-
296
-
297
-
298
-
299
-
300
-
301
-
302
-
303
-
304
-
305
-
306
-
307
-
308
-
309
-
310
-
311
-
312
-
313
-
314
-
315
-
316
-
317
-
318
-
319
-
320
-
321
-
322
-
323
-
324
 |
 |

254
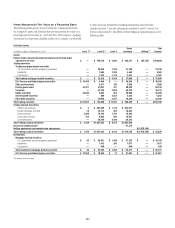
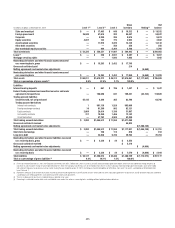
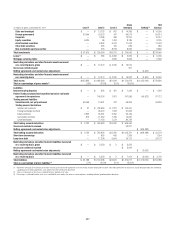
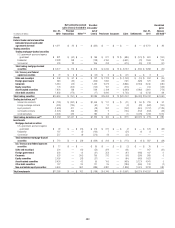
Items Measured at Fair Value on a Recurring Basis
The following tables present for each of the fair value hierarchy levels
the Company’s assets and liabilities that are measured at fair value on a
recurring basis at December 31, 2012 and 2011. The Company’s hedging
ofpositionsthathavebeenclassifiedintheLevel3categoryisnotlimited
to other financial instruments (hedging instruments) that have been
classifiedasLevel3,butalsoinstrumentsclassifiedasLevel1orLevel2of
the fair value hierarchy. The effects of these hedges are presented gross in the
following table.
Fair Value Levels
In millions of dollars at December 31, 2012 Level 1 (1) Level 2 (1) Level 3
Gross
inventory Netting (2)
Net
balance
Assets
Federal funds sold and securities borrowed or purchased under
agreements to resell $ — $ 198,278 $ 5,043 $ 203,321 $ (42,732) $160,589
Trading securities
Trading mortgage-backed securities
U.S. government-sponsored agency guaranteed — 29,835 1,325 31,160 — 31,160
Residential — 1,663 1,805 3,468 — 3,468
Commercial — 1,322 1,119 2,441 — 2,441
Total trading mortgage-backed securities $ — $ 32,820 $ 4,249 $ 37,069 $ — $ 37,069
U.S. Treasury and federal agency securities $ 15,416 $ 4,940 $ — $ 20,356 $ — $ 20,356
State and municipal — 3,611 195 3,806 — 3,806
Foreign government 57,831 31,097 311 89,239 — 89,239
Corporate — 33,194 2,030 35,224 — 35,224
Equity securities 54,640 2,094 264 56,998 — 56,998
Asset-backed securities — 899 4,453 5,352 — 5,352
Other debt securities — 15,944 2,321 18,265 — 18,265
Total trading securities $127,887 $ 124,599 $ 13,823 $ 266,309 $ — $266,309
Trading account derivatives
Interest rate contracts $ 2 $ 901,809 $ 1,710 $ 903,521
Foreign exchange contracts 18 75,712 902 76,632
Equity contracts 2,359 14,193 1,741 18,293
Commodity contracts 410 9,802 695 10,907
Credit derivatives — 50,109 4,166 54,275
Total trading account derivatives $ 2,789 $1,051,625 $ 9,214 $1,063,628
Gross cash collateral paid 61,152
Netting agreements and market value adjustments $(1,070,160)
Total trading account derivatives $ 2,789 $1,051,625 $ 9,214 $1,124,780 $(1,070,160) $ 54,620
Investments
Mortgage-backed securities
U.S. government-sponsored agency guaranteed $ 46 $ 45,841 $ 1,458 $ 47,345 $ — $ 47,345
Residential — 7,472 205 7,677 — 7,677
Commercial — 449 — 449 — 449
Total investment mortgage-backed securities $ 46 $ 53,762 $ 1,663 $ 55,471 $ — $ 55,471
U.S. Treasury and federal agency securities $ 13,204 $ 78,625 $ 12 $ 91,841 $ — $ 91,841
See footnotes on the next page.