Citibank 2012 Annual Report Download - page 228
Download and view the complete annual report
Please find page 228 of the 2012 Citibank annual report below. You can navigate through the pages in the report by either clicking on the pages listed below, or by using the keyword search tool below to find specific information within the annual report.-
 1
1 -
2
-
3
-
4
-
5
-
6
-
7
-
8
-
9
-
10
-
11
-
12
-
13
-
14
-
15
-
16
-
17
-
18
-
19
-
20
-
21
-
22
-
23
-
24
-
25
-
26
-
27
-
28
-
29
-
30
-
31
-
32
-
33
-
34
-
35
-
36
-
37
-
38
-
39
-
40
-
41
-
42
-
43
-
44
-
45
-
46
-
47
-
48
-
49
-
50
-
51
-
52
-
53
-
54
-
55
-
56
-
57
-
58
-
59
-
60
-
61
-
62
-
63
-
64
-
65
-
66
-
67
-
68
-
69
-
70
-
71
-
72
-
73
-
74
-
75
-
76
-
77
-
78
-
79
-
80
-
81
-
82
-
83
-
84
-
85
-
86
-
87
-
88
-
89
-
90
-
91
-
92
-
93
-
94
-
95
-
96
-
97
-
98
-
99
-
100
-
101
-
102
-
103
-
104
-
105
-
106
-
107
-
108
-
109
-
110
-
111
-
112
-
113
-
114
-
115
-
116
-
117
-
118
-
119
-
120
-
121
-
122
-
123
-
124
-
125
-
126
-
127
-
128
-
129
-
130
-
131
-
132
-
133
-
134
-
135
-
136
-
137
-
138
-
139
-
140
-
141
-
142
-
143
-
144
-
145
-
146
-
147
-
148
-
149
-
150
-
151
-
152
-
153
-
154
-
155
-
156
-
157
-
158
-
159
-
160
-
161
-
162
-
163
-
164
-
165
-
166
-
167
-
168
-
169
-
170
-
171
-
172
-
173
-
174
-
175
-
176
-
177
-
178
-
179
-
180
-
181
-
182
-
183
-
184
-
185
-
186
-
187
-
188
-
189
-
190
-
191
-
192
-
193
-
194
-
195
-
196
-
197
-
198
-
199
-
200
-
201
-
202
-
203
-
204
-
205
-
206
-
207
-
208
-
209
-
210
-
211
-
212
-
213
-
214
-
215
-
216
-
217
-
 218
218 -
 219
219 -
 220
220 -
 221
221 -
 222
222 -
 223
223 -
 224
224 -
 225
225 -
 226
226 -
 227
227 -
 228
228 -
 229
229 -
 230
230 -
 231
231 -
 232
232 -
 233
233 -
 234
234 -
 235
235 -
 236
236 -
 237
237 -
 238
238 -
239
-
240
-
241
-
242
-
243
-
244
-
245
-
246
-
247
-
248
-
249
-
250
-
251
-
252
-
253
-
254
-
255
-
256
-
257
-
258
-
259
-
260
-
261
-
262
-
263
-
264
-
265
-
266
-
267
-
268
-
269
-
270
-
271
-
272
-
273
-
274
-
275
-
276
-
277
-
278
-
279
-
280
-
281
-
282
-
283
-
284
-
285
-
286
-
287
-
288
-
289
-
290
-
291
-
292
-
293
-
294
-
295
-
296
-
297
-
298
-
299
-
300
-
301
-
302
-
303
-
304
-
305
-
306
-
307
-
308
-
309
-
310
-
311
-
312
-
313
-
314
-
315
-
316
-
317
-
318
-
319
-
320
-
321
-
322
-
323
-
324
 |
 |

206
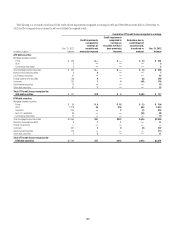
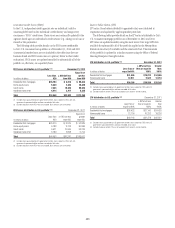
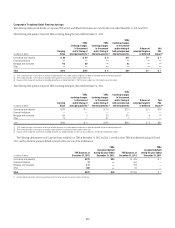
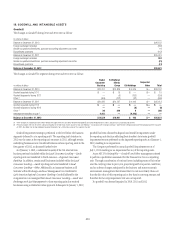
The following table presents Consumer TDRs that defaulted during the years
ended December 31, 2012 and 2011, respectively, and for which the payment
default occurred within one year of the modification:
In millions of dollars
Year ended
December 31, 2012 (1)
Year ended
December 31, 2011 (1)
North America
Residential first mortgages $1,145 $1,713
Home equity loans 128 113
Credit cards 434 1,307
Installment and other revolving 121 113
Commercial markets —3
Total $1,828 $3,249
International
Residential first mortgages $ 64 $ 123
Home equity loans 12
Credit cards 209 329
Installment and other revolving 117 238
Commercial markets 514
Total $ 396 $ 706
(1) Default is defined as 60 days past due, except for classifiably managed commercial markets loans,
where default is defined as 90+ days past due.
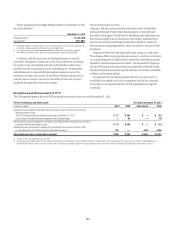
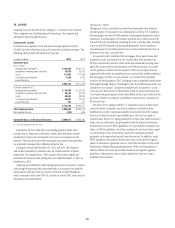
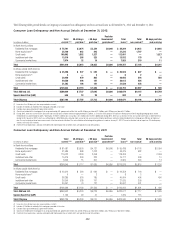
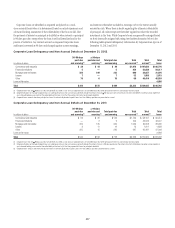
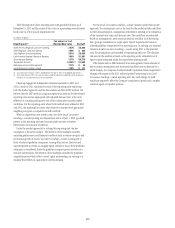
Corporate Loans
Corporate loans represent loans and leases managed by the Institutional
Clients Group or the Special Asset Pool in Citi Holdings. The following table
presents information by Corporate loan type as of December 31, 2012 and 2011:
In millions of dollars
December 31,
2012
December 31,
2011
Corporate
In U.S. offices
Commercial and industrial $ 26,985 $ 20,830
Financial institutions 18,159 15,113
Mortgage and real estate (1) 24,705 21,516
Installment, revolving credit and other 32,446 33,182
Lease financing 1,410 1,270
$103,705 $ 91,911
In offices outside the U.S.
Commercial and industrial $ 82,939 $ 79,764
Installment, revolving credit and other 14,958 14,114
Mortgage and real estate (1) 6,485 6,885
Financial institutions 37,739 29,794
Lease financing 605 568
Governments and official institutions 1,159 1,576
$143,885 $132,701
Total Corporate loans $247,590 $224,612
Net unearned income (loss) (797) (710)
Corporate loans, net of unearned income $246,793 $223,902
(1) Loans secured primarily by real estate.
For the years ended December 31, 2012 and 2011, the Company
sold and/or reclassified (to held-for-sale) $4.4 billion and $6.4 billion,
respectively, of held-for-investment Corporate loans. The Company
did not have significant purchases of Corporate loans classified as
held-for-investment for the year ended December 31, 2012 or December 31,
2011.