Citibank 2012 Annual Report Download - page 149
Download and view the complete annual report
Please find page 149 of the 2012 Citibank annual report below. You can navigate through the pages in the report by either clicking on the pages listed below, or by using the keyword search tool below to find specific information within the annual report.-
 1
1 -
2
-
3
-
4
-
5
-
6
-
7
-
8
-
9
-
10
-
11
-
12
-
13
-
14
-
15
-
16
-
17
-
18
-
19
-
20
-
21
-
22
-
23
-
24
-
25
-
26
-
27
-
28
-
29
-
30
-
31
-
32
-
33
-
34
-
35
-
36
-
37
-
38
-
39
-
40
-
41
-
42
-
43
-
44
-
45
-
46
-
47
-
48
-
49
-
50
-
51
-
52
-
53
-
54
-
55
-
56
-
57
-
58
-
59
-
60
-
61
-
62
-
63
-
64
-
65
-
66
-
67
-
68
-
69
-
70
-
71
-
72
-
73
-
74
-
75
-
76
-
77
-
78
-
79
-
80
-
81
-
82
-
83
-
84
-
85
-
86
-
87
-
88
-
89
-
90
-
91
-
92
-
93
-
94
-
95
-
96
-
97
-
98
-
99
-
100
-
101
-
102
-
103
-
104
-
105
-
106
-
107
-
108
-
109
-
110
-
111
-
112
-
113
-
114
-
115
-
116
-
117
-
118
-
119
-
120
-
121
-
122
-
123
-
124
-
125
-
126
-
127
-
128
-
129
-
130
-
131
-
132
-
133
-
134
-
135
-
136
-
137
-
138
-
 139
139 -
 140
140 -
 141
141 -
 142
142 -
 143
143 -
 144
144 -
 145
145 -
 146
146 -
 147
147 -
 148
148 -
 149
149 -
 150
150 -
 151
151 -
 152
152 -
 153
153 -
 154
154 -
 155
155 -
 156
156 -
 157
157 -
 158
158 -
 159
159 -
160
-
161
-
162
-
163
-
164
-
165
-
166
-
167
-
168
-
169
-
170
-
171
-
172
-
173
-
174
-
175
-
176
-
177
-
178
-
179
-
180
-
181
-
182
-
183
-
184
-
185
-
186
-
187
-
188
-
189
-
190
-
191
-
192
-
193
-
194
-
195
-
196
-
197
-
198
-
199
-
200
-
201
-
202
-
203
-
204
-
205
-
206
-
207
-
208
-
209
-
210
-
211
-
212
-
213
-
214
-
215
-
216
-
217
-
218
-
219
-
220
-
221
-
222
-
223
-
224
-
225
-
226
-
227
-
228
-
229
-
230
-
231
-
232
-
233
-
234
-
235
-
236
-
237
-
238
-
239
-
240
-
241
-
242
-
243
-
244
-
245
-
246
-
247
-
248
-
249
-
250
-
251
-
252
-
253
-
254
-
255
-
256
-
257
-
258
-
259
-
260
-
261
-
262
-
263
-
264
-
265
-
266
-
267
-
268
-
269
-
270
-
271
-
272
-
273
-
274
-
275
-
276
-
277
-
278
-
279
-
280
-
281
-
282
-
283
-
284
-
285
-
286
-
287
-
288
-
289
-
290
-
291
-
292
-
293
-
294
-
295
-
296
-
297
-
298
-
299
-
300
-
301
-
302
-
303
-
304
-
305
-
306
-
307
-
308
-
309
-
310
-
311
-
312
-
313
-
314
-
315
-
316
-
317
-
318
-
319
-
320
-
321
-
322
-
323
-
324
 |
 |
127
Regardless of the classification of the securities as AFS or HTM, Citi
assesses each position with an unrealized loss for OTTI.
Management assesses equity method investments with fair value less
than carrying value for OTTI, as discussed in Note 15 to the Consolidated
Financial Statements. For investments that management does not plan to sell
prior to recovery of value, or Citi is not likely to be required to sell, various
factors are considered in assessing OTTI. For investments that Citi plans to
sell prior to recovery of value, or would likely be required to sell and there
is no expectation that the fair value will recover prior to the expected sale
date, the full impairment would be recognized in the Consolidated Statement
of Income. The following paragraphs discuss Citi’s significant OTTI equity
method investments during 2012.
Akbank
In March 2012, Citi decided to reduce its ownership interest in Akbank T.A.S.,
an equity investment in Turkey (Akbank), to below 10%. As of March 31,
2012, Citi held a 20% equity interest in Akbank, which it purchased in
January 2007, accounted for as an equity method investment. As a result
of its decision to sell its share holdings in Akbank, in the first quarter of
2012 Citi recorded an impairment charge related to its total investment
in Akbank amounting to approximately $1.2 billion pretax ($763 million
after-tax). This impairment charge was primarily driven by the recognition
of all respective net investment foreign currency hedging and translation
losses previously reflected in AOCI as well as a reduction in carrying value
of the investment to reflect the market price of Akbank’s shares. The
impairment charge was recorded in other-than-temporary impairment losses
on investments in the Consolidated Statement of Income. During the second
quarter of 2012, Citi sold a 10.1% stake in Akbank, resulting in a loss on sale
of $424 million ($274 million after-tax), recorded within other revenue. As of
December 31, 2012, the remaining 9.9% stake in Akbank is recorded within
marketable equity securities available-for-sale.
MSSB
On September 17, 2012, Citi sold to Morgan Stanley a 14% interest (14%
Interest) in MSSB to which Morgan Stanley exercised its purchase option
on June 1, 2012. Morgan Stanley paid to Citi $1.89 billion in cash as the
purchase price of the 14% Interest. The purchase price was based on an
implied 100% valuation of MSSB of $13.5 billion, as agreed between Morgan
Stanley and Citi pursuant to an agreement dated September 11, 2012 (for
additional information, see Citi’s Form 8-K filed with the U.S. Securities
and Exchange Commission on September 11, 2012 and “Citi Holdings—
Brokerage and Asset Management” above). The related approximate
$4.5 billion in deposits were transferred to Morgan Stanley at no premium, as
agreed between the parties.
In addition, Morgan Stanley has agreed, subject to obtaining regulatory
approval, to purchase Citi’s remaining 35% interest in MSSB no later than
June 1, 2015 at a purchase price of $4.725 billion, which is based on the
same implied 100% valuation of MSSB of $13.5 billion.
Prior to the September 2012 sale, Citi’s carrying value of its 49% interest in
MSSB was approximately $11.3 billion. As a result of the agreement entered
into with Morgan Stanley on September 11, 2012, Citi recorded a charge
to net income in the third quarter of 2012 of approximately $2.9 billion
after-tax ($4.7 billion pretax), consisting of (i) a charge recorded within
Other revenue of approximately $800 million after-tax ($1.3 billion pretax),
representing a loss on sale of the 14% Interest, and (ii) an other-than-
temporary impairment of the carrying value of its remaining 35% interest in
MSSB of approximately $2.1 billion after-tax ($3.4 billion pretax).
As of December 31, 2012, Citi continues to account for its remaining 35%
interest in MSSB under the equity method, with the carrying value capped at
the agreed selling price of $4.725 billion.
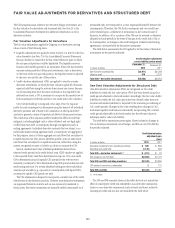
CVA/DVA Methodology
ASC 820-10 requires that Citi’s own credit risk be considered in determining
the market value of any Citi liability carried at fair value. These liabilities
include derivative instruments as well as debt and other liabilities for which
the fair value option has been elected. The credit valuation adjustment (CVA)
is recognized on the Consolidated Balance Sheet as a reduction or increase in
the associated derivative asset or liability to arrive at the fair value (carrying
value) of the derivative asset or liability. The debt valuation adjustment
(DVA) is recognized on the balance sheet as a reduction or increase in
the associated fair value option debt liability to arrive at the fair value of
the liability. For additional information, see “Fair Value Adjustments for
Derivatives and Structured Debt” above.
Allowance for Credit Losses
Allowance for Funded Lending Commitments
Management provides reserves for an estimate of probable losses inherent
in the funded loan portfolio on the Consolidated Balance Sheet in the
form of an allowance for loan losses. These reserves are established in
accordance with Citigroup’s credit reserve policies, as approved by the
Audit Committee of the Board of Directors. Citi’s Chief Risk Officer and
Chief Financial Officer review the adequacy of the credit loss reserves each
quarter with representatives from the risk management and finance staffs
for each applicable business area. Applicable business areas include those
having classifiably managed portfolios, where internal credit-risk ratings
are assigned (primarily Institutional Clients Group and Global Consumer
Banking), or modified Consumer loans, where concessions were granted due
to the borrowers’ financial difficulties.
The above-mentioned representatives covering these respective business
areas present recommended reserve balances for their funded and unfunded
lending portfolios along with supporting quantitative and qualitative data.
The quantitative data include: