Citibank 2012 Annual Report Download - page 310
Download and view the complete annual report
Please find page 310 of the 2012 Citibank annual report below. You can navigate through the pages in the report by either clicking on the pages listed below, or by using the keyword search tool below to find specific information within the annual report.-
 1
1 -
2
-
3
-
4
-
5
-
6
-
7
-
8
-
9
-
10
-
11
-
12
-
13
-
14
-
15
-
16
-
17
-
18
-
19
-
20
-
21
-
22
-
23
-
24
-
25
-
26
-
27
-
28
-
29
-
30
-
31
-
32
-
33
-
34
-
35
-
36
-
37
-
38
-
39
-
40
-
41
-
42
-
43
-
44
-
45
-
46
-
47
-
48
-
49
-
50
-
51
-
52
-
53
-
54
-
55
-
56
-
57
-
58
-
59
-
60
-
61
-
62
-
63
-
64
-
65
-
66
-
67
-
68
-
69
-
70
-
71
-
72
-
73
-
74
-
75
-
76
-
77
-
78
-
79
-
80
-
81
-
82
-
83
-
84
-
85
-
86
-
87
-
88
-
89
-
90
-
91
-
92
-
93
-
94
-
95
-
96
-
97
-
98
-
99
-
100
-
101
-
102
-
103
-
104
-
105
-
106
-
107
-
108
-
109
-
110
-
111
-
112
-
113
-
114
-
115
-
116
-
117
-
118
-
119
-
120
-
121
-
122
-
123
-
124
-
125
-
126
-
127
-
128
-
129
-
130
-
131
-
132
-
133
-
134
-
135
-
136
-
137
-
138
-
139
-
140
-
141
-
142
-
143
-
144
-
145
-
146
-
147
-
148
-
149
-
150
-
151
-
152
-
153
-
154
-
155
-
156
-
157
-
158
-
159
-
160
-
161
-
162
-
163
-
164
-
165
-
166
-
167
-
168
-
169
-
170
-
171
-
172
-
173
-
174
-
175
-
176
-
177
-
178
-
179
-
180
-
181
-
182
-
183
-
184
-
185
-
186
-
187
-
188
-
189
-
190
-
191
-
192
-
193
-
194
-
195
-
196
-
197
-
198
-
199
-
200
-
201
-
202
-
203
-
204
-
205
-
206
-
207
-
208
-
209
-
210
-
211
-
212
-
213
-
214
-
215
-
216
-
217
-
218
-
219
-
220
-
221
-
222
-
223
-
224
-
225
-
226
-
227
-
228
-
229
-
230
-
231
-
232
-
233
-
234
-
235
-
236
-
237
-
238
-
239
-
240
-
241
-
242
-
243
-
244
-
245
-
246
-
247
-
248
-
249
-
250
-
251
-
252
-
253
-
254
-
255
-
256
-
257
-
258
-
259
-
260
-
261
-
262
-
263
-
264
-
265
-
266
-
267
-
268
-
269
-
270
-
271
-
272
-
273
-
274
-
275
-
276
-
277
-
278
-
279
-
280
-
281
-
282
-
283
-
284
-
285
-
286
-
287
-
288
-
289
-
290
-
291
-
292
-
293
-
294
-
295
-
296
-
297
-
298
-
299
-
 300
300 -
 301
301 -
 302
302 -
 303
303 -
 304
304 -
 305
305 -
 306
306 -
 307
307 -
 308
308 -
 309
309 -
 310
310 -
 311
311 -
 312
312 -
 313
313 -
 314
314 -
 315
315 -
 316
316 -
 317
317 -
 318
318 -
 319
319 -
 320
320 -
321
-
322
-
323
-
324
 |
 |

288
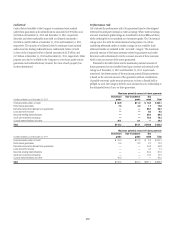
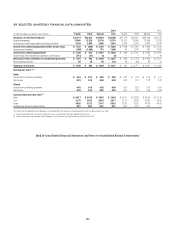
29. SELECTED QUARTERLY FINANCIAL DATA (UNAUDITED)
2012 2011
In millions of dollars, except per share amounts Fourth Third Second First Fourth Third Second First
Revenues, net of interest expense $18,174 $13,951 $18,642 $19,406 $17,174 $20,831 $20,622 $19,726
Operating expenses 13,845 12,220 12,134 12,319 13,211 12,460 12,936 12,326
Provisions for credit losses and for benefits and claims 3,199 2,695 2,806 3,019 2,874 3,351 3,387 3,184
Income from continuing operations before income taxes $ 1,130 $ (964) $ 3,702 $ 4,068 $ 1,089 $ 5,020 $ 4,299 $ 4,216
Income taxes (benefits) (206) (1,488) 715 1,006 91 1,278 967 1,185
Income from continuing operations $ 1,336 $ 524 $ 2,987 $ 3,062 $ 998 $ 3,742 $ 3,332 $ 3,031
Income (loss) from discontinued operations, net of taxes (112) (31) (1) (5) — 1 71 40
Net income before attribution of noncontrolling interests $ 1,224 $ 493 $ 2,986 $ 3,057 $ 998 $ 3,743 $ 3,403 $ 3,071
Noncontrolling interests 28 25 40 126 42 (28) 62 72
Citigroup’s net income $ 1,196 $ 468 $ 2,946 $ 2,931 $ 956 $ 3,771 $ 3,341 $ 2,999
Earnings per share (1)(2)
Basic
Income from continuing operations $ 0.43 $ 0.17 $ 0.98 $ 0.98 $ 0.32 $ 1.27 $ 1.10 $ 1.01
Net income 0.39 0.15 0.98 0.98 0.32 1.27 1.12 1.02
Diluted
Income from continuing operations 0.42 0.16 0.95 0.96 0.31 1.23 1.07 0.97
Net income 0.38 0.15 0.95 0.95 0.31 1.23 1.09 0.99
Common stock price per share (2)
High $ 40.17 $ 34.79 $ 36.87 $ 38.08 $ 34.17 $ 42.88 $ 45.90 $ 51.30
Low 32.75 25.24 24.82 28.17 23.11 23.96 36.81 43.90
Close 39.56 32.72 27.41 36.55 26.31 25.62 41.64 44.20
Dividends per share of common stock 0.01 0.01 0.01 0.01 0.01 0.01 0.01 —
This Note to the Consolidated Financial Statements is unaudited due to the Company’s individual quarterly results not being subject to an audit.
(1) Due to averaging of shares, quarterly earnings per share may not add up to the totals reported for the full year.
(2) All per-share amounts for all periods reflect Citigroup’s 1-for-10 reverse stock split, which was effective May 6, 2011.
[End of Consolidated Financial Statements and Notes to Consolidated Financial Statements]