Citibank 2012 Annual Report Download - page 220
Download and view the complete annual report
Please find page 220 of the 2012 Citibank annual report below. You can navigate through the pages in the report by either clicking on the pages listed below, or by using the keyword search tool below to find specific information within the annual report.-
 1
1 -
2
-
3
-
4
-
5
-
6
-
7
-
8
-
9
-
10
-
11
-
12
-
13
-
14
-
15
-
16
-
17
-
18
-
19
-
20
-
21
-
22
-
23
-
24
-
25
-
26
-
27
-
28
-
29
-
30
-
31
-
32
-
33
-
34
-
35
-
36
-
37
-
38
-
39
-
40
-
41
-
42
-
43
-
44
-
45
-
46
-
47
-
48
-
49
-
50
-
51
-
52
-
53
-
54
-
55
-
56
-
57
-
58
-
59
-
60
-
61
-
62
-
63
-
64
-
65
-
66
-
67
-
68
-
69
-
70
-
71
-
72
-
73
-
74
-
75
-
76
-
77
-
78
-
79
-
80
-
81
-
82
-
83
-
84
-
85
-
86
-
87
-
88
-
89
-
90
-
91
-
92
-
93
-
94
-
95
-
96
-
97
-
98
-
99
-
100
-
101
-
102
-
103
-
104
-
105
-
106
-
107
-
108
-
109
-
110
-
111
-
112
-
113
-
114
-
115
-
116
-
117
-
118
-
119
-
120
-
121
-
122
-
123
-
124
-
125
-
126
-
127
-
128
-
129
-
130
-
131
-
132
-
133
-
134
-
135
-
136
-
137
-
138
-
139
-
140
-
141
-
142
-
143
-
144
-
145
-
146
-
147
-
148
-
149
-
150
-
151
-
152
-
153
-
154
-
155
-
156
-
157
-
158
-
159
-
160
-
161
-
162
-
163
-
164
-
165
-
166
-
167
-
168
-
169
-
170
-
171
-
172
-
173
-
174
-
175
-
176
-
177
-
178
-
179
-
180
-
181
-
182
-
183
-
184
-
185
-
186
-
187
-
188
-
189
-
190
-
191
-
192
-
193
-
194
-
195
-
196
-
197
-
198
-
199
-
200
-
201
-
202
-
203
-
204
-
205
-
206
-
207
-
208
-
209
-
 210
210 -
 211
211 -
 212
212 -
 213
213 -
 214
214 -
 215
215 -
 216
216 -
 217
217 -
 218
218 -
 219
219 -
 220
220 -
 221
221 -
 222
222 -
 223
223 -
 224
224 -
 225
225 -
 226
226 -
 227
227 -
 228
228 -
 229
229 -
 230
230 -
231
-
232
-
233
-
234
-
235
-
236
-
237
-
238
-
239
-
240
-
241
-
242
-
243
-
244
-
245
-
246
-
247
-
248
-
249
-
250
-
251
-
252
-
253
-
254
-
255
-
256
-
257
-
258
-
259
-
260
-
261
-
262
-
263
-
264
-
265
-
266
-
267
-
268
-
269
-
270
-
271
-
272
-
273
-
274
-
275
-
276
-
277
-
278
-
279
-
280
-
281
-
282
-
283
-
284
-
285
-
286
-
287
-
288
-
289
-
290
-
291
-
292
-
293
-
294
-
295
-
296
-
297
-
298
-
299
-
300
-
301
-
302
-
303
-
304
-
305
-
306
-
307
-
308
-
309
-
310
-
311
-
312
-
313
-
314
-
315
-
316
-
317
-
318
-
319
-
320
-
321
-
322
-
323
-
324
 |
 |
198
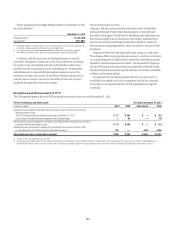
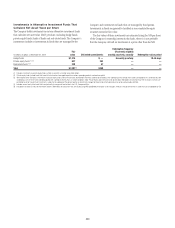
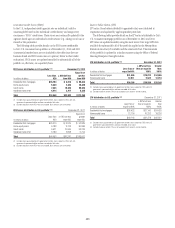
The key assumptions for mortgage-backed securities as of December 31, 2012
are in the table below:
December 31, 2012
Prepayment rate (1) 1%–8% CRR
Loss severity (2) 45%–90%
(1) Conditional repayment rate (CRR) represents the annualized expected rate of voluntary prepayment of
principal for mortgage-backed securities over a certain period of time.
(2) Loss severity rates are estimated considering collateral characteristics and generally range from
45%–60% for prime bonds, 50%–90% for Alt-A bonds and 65%–90% for subprime bonds.
In addition, cash flow projections are developed using more stressful
parameters. Management assesses the results of those stress tests (including
the severity of any cash shortfall indicated and the likelihood of the stress
scenarios actually occurring based on the underlying pool’s characteristics
and performance) to assess whether management expects to recover the
amortized cost basis of the security. If cash flow projections indicate that the
Company does not expect to recover its amortized cost basis, the Company
recognizes the estimated credit loss in earnings.
State and municipal securities
Citigroup’s AFS state and municipal bonds consist mainly of bonds that
are financed through Tender Option Bond programs or were previously
financed in this program. The process for identifying credit impairments for
these bonds is largely based on third-party credit ratings. Individual bond
positions that are financed through Tender Option Bonds are required to
meet minimum ratings requirements, which vary based on the sector of the
bond issuer.
Citigroup monitors the bond issuer and insurer ratings on a daily basis.
The average portfolio rating, ignoring any insurance, is Aa3/AA-. In the event
of a rating downgrade, the subject bond is specifically reviewed for potential
shortfall in contractual principal and interest. The remainder of Citigroup’s
AFS and HTM state and municipal bonds are specifically reviewed for credit
impairment based on instrument-specific estimates of cash flows, probability
of default and loss given default.
For impaired AFS state and municipal bonds that Citi plans to sell, or
would likely be required to sell with no expectation that the fair value will
recover prior to the expected sale date, the full impairment is recognized
in earnings.
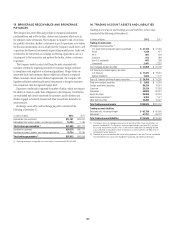
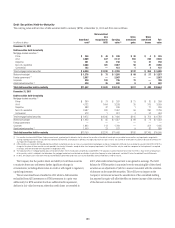
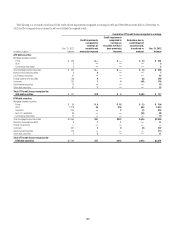
Recognition and Measurement of OTTI
The following table presents the total OTTI recognized in earnings for the year ended December 31, 2012:
OTTI on Investments and Other Assets Year Ended December 31, 2012
In millions of dollars AFS (1) HTM Other Assets Total
Impairment losses related to securities that the Company does not intend to sell nor will
likely be required to sell:
Total OTTI losses recognized during the year ended December 31, 2012 $ 17 $ 365 $ — $ 382
Less: portion of impairment loss recognized in AOCI (before taxes) 1 65 — 66
Net impairment losses recognized in earnings for securities that the Company does not intend
to sell nor will likely be required to sell $ 16 $ 300 $ — $ 316
Impairment losses recognized in earnings for securities that the Company intends to sell
or more-likely-than-not will be required to sell before recovery (2) 139 — 4,516 4,655
Total impairment losses recognized in earnings $155 $ 300 $4,516 $ 4,971
(1) Includes OTTI on non-marketable equity securities.
(2) As described under “MSSB” above, the third quarter of 2012 includes the recognition of a $3,340 million impairment charge related to the carrying value of Citi’s remaining 35% interest in MSSB. Additionally, as
described under “Akbank” above, in the first quarter of 2012, the Company recorded an impairment charge relating to its total investment in Akbank amounting to $1.2 billion pretax ($763 million after-tax).