Citibank 2012 Annual Report Download - page 132
Download and view the complete annual report
Please find page 132 of the 2012 Citibank annual report below. You can navigate through the pages in the report by either clicking on the pages listed below, or by using the keyword search tool below to find specific information within the annual report.-
 1
1 -
2
-
3
-
4
-
5
-
6
-
7
-
8
-
9
-
10
-
11
-
12
-
13
-
14
-
15
-
16
-
17
-
18
-
19
-
20
-
21
-
22
-
23
-
24
-
25
-
26
-
27
-
28
-
29
-
30
-
31
-
32
-
33
-
34
-
35
-
36
-
37
-
38
-
39
-
40
-
41
-
42
-
43
-
44
-
45
-
46
-
47
-
48
-
49
-
50
-
51
-
52
-
53
-
54
-
55
-
56
-
57
-
58
-
59
-
60
-
61
-
62
-
63
-
64
-
65
-
66
-
67
-
68
-
69
-
70
-
71
-
72
-
73
-
74
-
75
-
76
-
77
-
78
-
79
-
80
-
81
-
82
-
83
-
84
-
85
-
86
-
87
-
88
-
89
-
90
-
91
-
92
-
93
-
94
-
95
-
96
-
97
-
98
-
99
-
100
-
101
-
102
-
103
-
104
-
105
-
106
-
107
-
108
-
109
-
110
-
111
-
112
-
113
-
114
-
115
-
116
-
117
-
118
-
119
-
120
-
121
-
 122
122 -
 123
123 -
 124
124 -
 125
125 -
 126
126 -
 127
127 -
 128
128 -
 129
129 -
 130
130 -
 131
131 -
 132
132 -
 133
133 -
 134
134 -
 135
135 -
 136
136 -
 137
137 -
 138
138 -
 139
139 -
 140
140 -
 141
141 -
 142
142 -
143
-
144
-
145
-
146
-
147
-
148
-
149
-
150
-
151
-
152
-
153
-
154
-
155
-
156
-
157
-
158
-
159
-
160
-
161
-
162
-
163
-
164
-
165
-
166
-
167
-
168
-
169
-
170
-
171
-
172
-
173
-
174
-
175
-
176
-
177
-
178
-
179
-
180
-
181
-
182
-
183
-
184
-
185
-
186
-
187
-
188
-
189
-
190
-
191
-
192
-
193
-
194
-
195
-
196
-
197
-
198
-
199
-
200
-
201
-
202
-
203
-
204
-
205
-
206
-
207
-
208
-
209
-
210
-
211
-
212
-
213
-
214
-
215
-
216
-
217
-
218
-
219
-
220
-
221
-
222
-
223
-
224
-
225
-
226
-
227
-
228
-
229
-
230
-
231
-
232
-
233
-
234
-
235
-
236
-
237
-
238
-
239
-
240
-
241
-
242
-
243
-
244
-
245
-
246
-
247
-
248
-
249
-
250
-
251
-
252
-
253
-
254
-
255
-
256
-
257
-
258
-
259
-
260
-
261
-
262
-
263
-
264
-
265
-
266
-
267
-
268
-
269
-
270
-
271
-
272
-
273
-
274
-
275
-
276
-
277
-
278
-
279
-
280
-
281
-
282
-
283
-
284
-
285
-
286
-
287
-
288
-
289
-
290
-
291
-
292
-
293
-
294
-
295
-
296
-
297
-
298
-
299
-
300
-
301
-
302
-
303
-
304
-
305
-
306
-
307
-
308
-
309
-
310
-
311
-
312
-
313
-
314
-
315
-
316
-
317
-
318
-
319
-
320
-
321
-
322
-
323
-
324
 |
 |

110
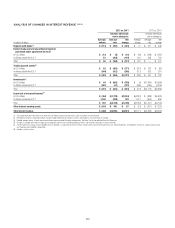
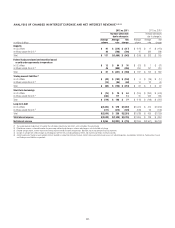
ANALYSIS OF CHANGES IN INTEREST REVENUE (1)(2)(3)
2012 vs. 2011 2011 vs. 2010
Increase (decrease)
due to change in:
Increase (decrease)
due to change in:
In millions of dollars
Average
volume
Average
rate
Net
change
Average
volume
Average
rate
Net
change
Deposits with banks (4) $ (114) $ (367) $ (481) $ 27 $ 471 $ 498
Federal funds sold and securities borrowed or
purchased under agreements to resell
In U.S. offices $ (12) $ (4) $ (16) $ (49) $ (238) $ (287)
In offices outside the U.S. (4) 67 (264) (197) 524 238 762
Total $ 55 $ (268) $ (213) $ 475 $ — $ 475
Trading account assets (5)
In U.S. offices $ 82 $ (453) $ (371) $ (214) $ 132 $ (82)
In offices outside the U.S. (4) (544) (412) (956) (111) 325 214
Total $ (462) $ (865) $(1,327) $ (325) $ 457 $ 132
Investments (1)
In U.S. offices $ 44 $ (583) $ (539) $ (9) $(1,480) $(1,489)
In offices outside the U.S. (4) (281) (41) (322) (565) (635) (1,200)
Total $ (237) $ (624) $ (861) $ (574) $(2,115) $(2,689)
Loans (net of unearned income) (6)
In U.S. offices $ (764) $(1,270) $(2,034) $(4,824) $ (838) $(5,662)
In offices outside the U.S. (4) 1,158 (830) 328 1,471 (603) 868
Total $ 394 $(2,100) $(1,706) $(3,353) $(1,441) $(4,794)
Other interest-earning assets $ (101) $ 168 $ 67 $ (21) $ (201) $ (222)
Total interest revenue $ (465) $(4,056) $(4,521) $(3,771) $(2,829) $(6,600)
(1) The taxable equivalent adjustment is based on the U.S. federal statutory tax rate of 35% and is included in this presentation.
(2) Rate/volume variance is allocated based on the percentage relationship of changes in volume and changes in rate to the total net change.
(3) Detailed average volume, Interest revenue and Interest expense exclude Discontinued operations. See Note 3 to the Consolidated Financial Statements.
(4) Changes in average rates reflect changes in prevailing local interest rates, including inflationary effects and monetary corrections in certain countries.
(5) Interest expense on Trading account liabilities of ICG is reported as a reduction of Interest revenue. Interest revenue and Interest expense on cash collateral positions are reported in interest on Trading account assets
and Trading account liabilities, respectively.
(6) Includes cash-basis loans.