Citibank 2012 Annual Report Download - page 227
Download and view the complete annual report
Please find page 227 of the 2012 Citibank annual report below. You can navigate through the pages in the report by either clicking on the pages listed below, or by using the keyword search tool below to find specific information within the annual report.-
 1
1 -
2
-
3
-
4
-
5
-
6
-
7
-
8
-
9
-
10
-
11
-
12
-
13
-
14
-
15
-
16
-
17
-
18
-
19
-
20
-
21
-
22
-
23
-
24
-
25
-
26
-
27
-
28
-
29
-
30
-
31
-
32
-
33
-
34
-
35
-
36
-
37
-
38
-
39
-
40
-
41
-
42
-
43
-
44
-
45
-
46
-
47
-
48
-
49
-
50
-
51
-
52
-
53
-
54
-
55
-
56
-
57
-
58
-
59
-
60
-
61
-
62
-
63
-
64
-
65
-
66
-
67
-
68
-
69
-
70
-
71
-
72
-
73
-
74
-
75
-
76
-
77
-
78
-
79
-
80
-
81
-
82
-
83
-
84
-
85
-
86
-
87
-
88
-
89
-
90
-
91
-
92
-
93
-
94
-
95
-
96
-
97
-
98
-
99
-
100
-
101
-
102
-
103
-
104
-
105
-
106
-
107
-
108
-
109
-
110
-
111
-
112
-
113
-
114
-
115
-
116
-
117
-
118
-
119
-
120
-
121
-
122
-
123
-
124
-
125
-
126
-
127
-
128
-
129
-
130
-
131
-
132
-
133
-
134
-
135
-
136
-
137
-
138
-
139
-
140
-
141
-
142
-
143
-
144
-
145
-
146
-
147
-
148
-
149
-
150
-
151
-
152
-
153
-
154
-
155
-
156
-
157
-
158
-
159
-
160
-
161
-
162
-
163
-
164
-
165
-
166
-
167
-
168
-
169
-
170
-
171
-
172
-
173
-
174
-
175
-
176
-
177
-
178
-
179
-
180
-
181
-
182
-
183
-
184
-
185
-
186
-
187
-
188
-
189
-
190
-
191
-
192
-
193
-
194
-
195
-
196
-
197
-
198
-
199
-
200
-
201
-
202
-
203
-
204
-
205
-
206
-
207
-
208
-
209
-
210
-
211
-
212
-
213
-
214
-
215
-
216
-
 217
217 -
 218
218 -
 219
219 -
 220
220 -
 221
221 -
 222
222 -
 223
223 -
 224
224 -
 225
225 -
 226
226 -
 227
227 -
 228
228 -
 229
229 -
 230
230 -
 231
231 -
 232
232 -
 233
233 -
 234
234 -
 235
235 -
 236
236 -
 237
237 -
238
-
239
-
240
-
241
-
242
-
243
-
244
-
245
-
246
-
247
-
248
-
249
-
250
-
251
-
252
-
253
-
254
-
255
-
256
-
257
-
258
-
259
-
260
-
261
-
262
-
263
-
264
-
265
-
266
-
267
-
268
-
269
-
270
-
271
-
272
-
273
-
274
-
275
-
276
-
277
-
278
-
279
-
280
-
281
-
282
-
283
-
284
-
285
-
286
-
287
-
288
-
289
-
290
-
291
-
292
-
293
-
294
-
295
-
296
-
297
-
298
-
299
-
300
-
301
-
302
-
303
-
304
-
305
-
306
-
307
-
308
-
309
-
310
-
311
-
312
-
313
-
314
-
315
-
316
-
317
-
318
-
319
-
320
-
321
-
322
-
323
-
324
 |
 |

205
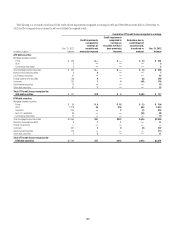
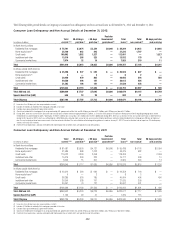
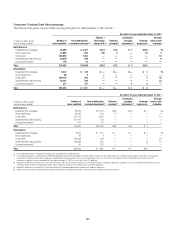
Consumer Troubled Debt Restructurings
The following tables present Consumer TDRs occurring during the years ended December 31, 2012 and 2011:
At and for the year ended December 31, 2012
In millions of dollars except
number of loans modified
Number of
loans modified
Post-modification
recorded investment (1)(2)
Chapter 7
bankruptcy
charge-offs (2)
Deferred
principal (3)
Contingent
principal
forgiveness (4)
Principal
forgiveness
Average
interest rate
reduction
North America
Residential first mortgages 59,869 $ 8,107 $ 154 $ 10 $ 7 $ 553 1%
Home equity loans 33,586 862 450 5 — 78 2
Credit cards 204,999 1,053 — — — — 16
Installment and other revolving 64,858 469 — — — — 6
Commercial markets (5) 170 18 — — — — —
Total 363,482 $10,509 $ 604 $ 15 $ 7 $ 631
International
Residential first mortgages 9,447 $ 324 $ — $ — $ — $ 2 1%
Home equity loans 58 4 — — — — —
Credit cards 206,755 632 — — — 1 29
Installment and other revolving 45,191 280 — — — 1 22
Commercial markets (5) 377 171 — — 1 2 —
Total 261,828 $ 1,411 $ — $ — $ 1 $ 6
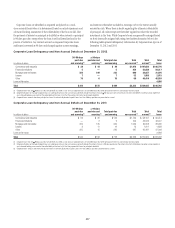
At and for the year ended December 31, 2011
In millions of dollars except
number of loans modified
Number of
loans modified
Post-modification
recorded investment (1)
Deferred
principal (3)
Contingent
principal
forgiveness (4)
Principal
forgiveness
Average
interest rate
reduction
North America
Residential first mortgages 33,025 $ 5,137 $ 66 $ 50 $ — 2%
Home equity loans 18,099 923 17 1 — 4
Credit cards 611,715 3,554 — — — 19
Installment and other revolving 101,107 756 — — — 4
Commercial markets (5) 579 55 — — 1 —
Total 764,525 $10,425 $ 83 $ 51 $ 1
International
Residential first mortgages 8,206 $ 311 $— $ — $ 5 1%
Home equity loans 61 4 — — — —
Credit cards 225,238 628 — — 2 24
Installment and other revolving 133,062 545 — — 8 12
Commercial markets (5) 55 167 — — 1 —
Total 366,622 $ 1,655 $ — $ — $ 16
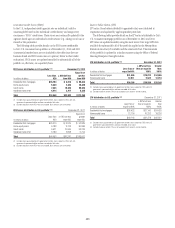
(1) Post-modification balances include past due amounts that are capitalized at modification date.
(2) Post-modification balances in North America include $2,740 million of residential first mortgages and $497 million of home equity loans to borrowers that have gone through Chapter 7 bankruptcy. These amounts
include $1,414 million of residential first mortgages and $409 million of home equity loans that are newly classified as TDRs as a result of this OCC guidance. Chapter 7 bankruptcy column amounts are the
incremental charge-offs that were recorded in the year ended December 31, 2012 as a result of this new OCC guidance.
(3) Represents portion of loan principal that is non-interest bearing but still due from borrower. Effective in the first quarter of 2012, such deferred principal is charged-off at the time of modification to the extent that the
related loan balance exceeds the underlying collateral value. A significant amount of the reported balances have been charged-off.
(4) Represents portion of loan principal that is non-interest bearing and, depending upon borrower performance, eligible for forgiveness.
(5) Commercial markets loans are generally borrower-specific modifications and incorporate changes in the amount and/or timing of principal and/or interest.