Citibank 2012 Annual Report Download - page 280
Download and view the complete annual report
Please find page 280 of the 2012 Citibank annual report below. You can navigate through the pages in the report by either clicking on the pages listed below, or by using the keyword search tool below to find specific information within the annual report.-
 1
1 -
2
-
3
-
4
-
5
-
6
-
7
-
8
-
9
-
10
-
11
-
12
-
13
-
14
-
15
-
16
-
17
-
18
-
19
-
20
-
21
-
22
-
23
-
24
-
25
-
26
-
27
-
28
-
29
-
30
-
31
-
32
-
33
-
34
-
35
-
36
-
37
-
38
-
39
-
40
-
41
-
42
-
43
-
44
-
45
-
46
-
47
-
48
-
49
-
50
-
51
-
52
-
53
-
54
-
55
-
56
-
57
-
58
-
59
-
60
-
61
-
62
-
63
-
64
-
65
-
66
-
67
-
68
-
69
-
70
-
71
-
72
-
73
-
74
-
75
-
76
-
77
-
78
-
79
-
80
-
81
-
82
-
83
-
84
-
85
-
86
-
87
-
88
-
89
-
90
-
91
-
92
-
93
-
94
-
95
-
96
-
97
-
98
-
99
-
100
-
101
-
102
-
103
-
104
-
105
-
106
-
107
-
108
-
109
-
110
-
111
-
112
-
113
-
114
-
115
-
116
-
117
-
118
-
119
-
120
-
121
-
122
-
123
-
124
-
125
-
126
-
127
-
128
-
129
-
130
-
131
-
132
-
133
-
134
-
135
-
136
-
137
-
138
-
139
-
140
-
141
-
142
-
143
-
144
-
145
-
146
-
147
-
148
-
149
-
150
-
151
-
152
-
153
-
154
-
155
-
156
-
157
-
158
-
159
-
160
-
161
-
162
-
163
-
164
-
165
-
166
-
167
-
168
-
169
-
170
-
171
-
172
-
173
-
174
-
175
-
176
-
177
-
178
-
179
-
180
-
181
-
182
-
183
-
184
-
185
-
186
-
187
-
188
-
189
-
190
-
191
-
192
-
193
-
194
-
195
-
196
-
197
-
198
-
199
-
200
-
201
-
202
-
203
-
204
-
205
-
206
-
207
-
208
-
209
-
210
-
211
-
212
-
213
-
214
-
215
-
216
-
217
-
218
-
219
-
220
-
221
-
222
-
223
-
224
-
225
-
226
-
227
-
228
-
229
-
230
-
231
-
232
-
233
-
234
-
235
-
236
-
237
-
238
-
239
-
240
-
241
-
242
-
243
-
244
-
245
-
246
-
247
-
248
-
249
-
250
-
251
-
252
-
253
-
254
-
255
-
256
-
257
-
258
-
259
-
260
-
261
-
262
-
263
-
264
-
265
-
266
-
267
-
268
-
269
-
 270
270 -
 271
271 -
 272
272 -
 273
273 -
 274
274 -
 275
275 -
 276
276 -
 277
277 -
 278
278 -
 279
279 -
 280
280 -
 281
281 -
 282
282 -
 283
283 -
 284
284 -
 285
285 -
 286
286 -
 287
287 -
 288
288 -
 289
289 -
 290
290 -
291
-
292
-
293
-
294
-
295
-
296
-
297
-
298
-
299
-
300
-
301
-
302
-
303
-
304
-
305
-
306
-
307
-
308
-
309
-
310
-
311
-
312
-
313
-
314
-
315
-
316
-
317
-
318
-
319
-
320
-
321
-
322
-
323
-
324
 |
 |

258
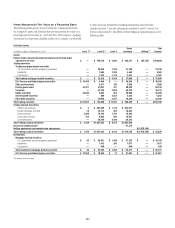
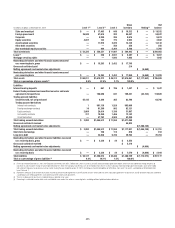
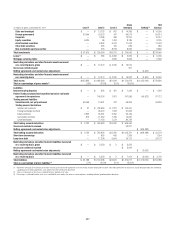
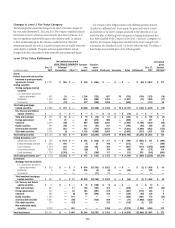
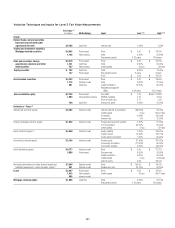
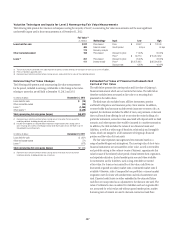
Changes in Level 3 Fair Value Category
The following tables present the changes in the Level 3 fair value category for
the years ended December 31, 2012 and 2011. The Company classifies financial
instruments as Level 3 of the fair value hierarchy when there is reliance on at
least one significant unobservable input to the valuation model. In addition
to these unobservable inputs, the valuation models for Level 3 financial
instruments typically also rely on a number of inputs that are readily observable
either directly or indirectly. The gains and losses presented below include
changes in the fair value related to both observable and unobservable inputs.
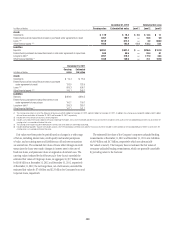
The Company often hedges positions with offsetting positions that are
classified in a different level. For example, the gains and losses for assets
and liabilities in the Level 3 category presented in the tables below do not
reflect the effect of offsetting losses and gains on hedging instruments that
have been classified by the Company in the Level 1 and Level 2 categories. In
addition, the Company hedges items classified in the Level 3 category with
instruments also classified in Level 3 of the fair value hierarchy. The effects of
these hedges are presented gross in the following tables.
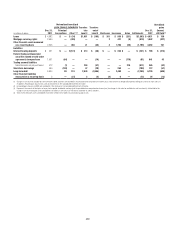
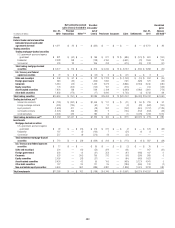
Level 3 Fair Value Rollforward
Net realized/unrealized
gains (losses) included in Transfers
into
Level 3
Transfers
out of
Level 3 Purchases Issuances Sales Settlements
Dec. 31,
2012
Unrealized
gains
(losses)
still held (3)
In millions of dollars
Dec. 31,
2011
Principal
transactions Other (1)(2)
Assets
Federal funds sold and securities
borrowed or purchased under
agreements to resell $4,701 $ 306 $ — $ 540 $ (444) $ — $ — $ — $ (60) $ 5,043 $ 317
Trading securities
Trading mortgage-backed
securities
U.S. government-sponsored
agency guaranteed 861 38 — 1,294 (735) 657 79 (735) (134) 1,325 (16)
Residential 1,509 204 — 848 (499) 1,652 — (1,897) (12) 1,805 (27)
Commercial 618 (32) — 327 (305) 1,056 — (545) — 1,119 28
Total trading mortgage-
backed securities $ 2,988 $ 210 $ — $ 2,469 $(1,539) $ 3,365 $ 79 $ (3,177) $ (146) $ 4,249 $ (15)
U.S. Treasury and federal
agency securities $ 3 $ — $ — $ — $ — $ 13 $ — $ (16) $ — $ — $ —
State and municipal $ 252 $ 24 $ — $ 19 $ (18) $ 61 $ — $ (143) $ — $ 195 $ (2)
Foreign government 521 25 — 89 (875) 960 — (409) — 311 5
Corporate 3,240 (90) — 464 (558) 2,622 — (1,942) (1,706) 2,030 (28)
Equity securities 244 (25) — 121 (47) 231 — (192) (68) 264 (5)
Asset-backed securities 5,801 503 — 222 (114) 6,873 — (7,823) (1,009) 4,453 (173)
Other debt securities 2,743 (8) — 1,126 (2,089) 2,954 — (2,092) (313) 2,321 376
Total trading securities $15,792 $ 639 $ — $ 4,510 $(5,240) $17,079 $ 79 $(15,794) $(3,242) $13,823 $ 158
Trading derivatives, net (4)
Interest rate contracts $ 726 $ (101) $ — $ 682 $ (438) $ 311 $ — $ (194) $ (805) $ 181 $ (298)
Foreign exchange contracts (562) 440 — (1) 25 196 — (213) 115 — (190)
Equity contracts (1,737) 326 — (34) 443 428 — (657) (217) (1,448) (506)
Commodity contracts (934) 145 — (66) 5 100 — (89) 68 (771) 114
Credit derivatives 1,728 (2,355) — 32 (188) 117 — (11) 335 (342) (692)
Total trading derivatives, net (4) $ (779) $(1,545) $ — $ 613 $ (153) $ 1,152 $ — $ (1,164) $ (504) $ (2,380) $(1,572)
Investments
Mortgage-backed securities
U.S. government-sponsored
agency guaranteed $ 679 $ — $ 7 $ 894 $(3,742) $ 3,622 $ — $ — $ (2) $ 1,458 $ 43
Residential 8 — 6 205 (6) 46 — (54) — 205 —
Commercial — — — — (11) 11 — — — — —
Total investment mortgage-
backed securities $ 687 $ — $ 13 $ 1,099 $(3,759) $ 3,679 $ — $ (54) $ (2) $ 1,663 $ 43
U.S. Treasury and federal
agency securities $ 75 $ — $ — $ 75 $ (150) $ 12 $ — $ — $ — $ 12 $ —
State and municipal 667 — 12 129 (153) 412 — (218) — 849 (20)
Foreign government 447 — 20 193 (297) 519 — (387) (112) 383 1
Corporate 989 — (6) 68 (698) 224 — (144) (48) 385 8
Equity securities 1,453 — 119 — — — — (308) (491) 773 (34)
Asset-backed securities 4,041 — (98) — (730) 930 — (77) (1,846) 2,220 1
Other debt securities 120 — (53) — — 310 — (118) (1) 258 —
Non-marketable equity
securities 8,318 — 453 — — 1,266 — (3,373) (1,300) 5,364 313
Total investments $16,797 $ — $ 460 $ 1,564 $(5,787) $ 7,352 $ — $ (4,679) $(3,800) $11,907 $ 312